

Wall Street Sentiment Daily for 6/15/10
Institutional Sentiment and Analysis
Tuesday 6/15/2010 at 9:20 am
By Mark Steward Young
The NEW tthq.com Wall Street Sentiment message board password is ******.
Short-Term Sentiment: Bearish.
Overall Intermediate-Term Sentiment: Mildly Bullish for the market.
Individual Investor Sentiment: Mixed for the market.
Small Speculator Sentiment: Neutral for the market.
Small Hedge Fund/Manager Sentiment: Very Mixed for the Market.
Longer-term Trend:
Bull Market Condition.
Intermediate-term Trend:
Negative. Turning up.
Short-term (one-day) Signal:
Repeat Sell. Strong.
We are trading these signals and others intra-day for our Premium subscribers--contact us for details ( http://www.wallstreetsentiment.com/contact.html).
Ideal ETF Portfolio (tracking portfolio):
25% QLD at 34.30
50% QID at 33.21
25% QLD at 26.09
Look to take off part of the hedge. We'll advise.
*******************************************************
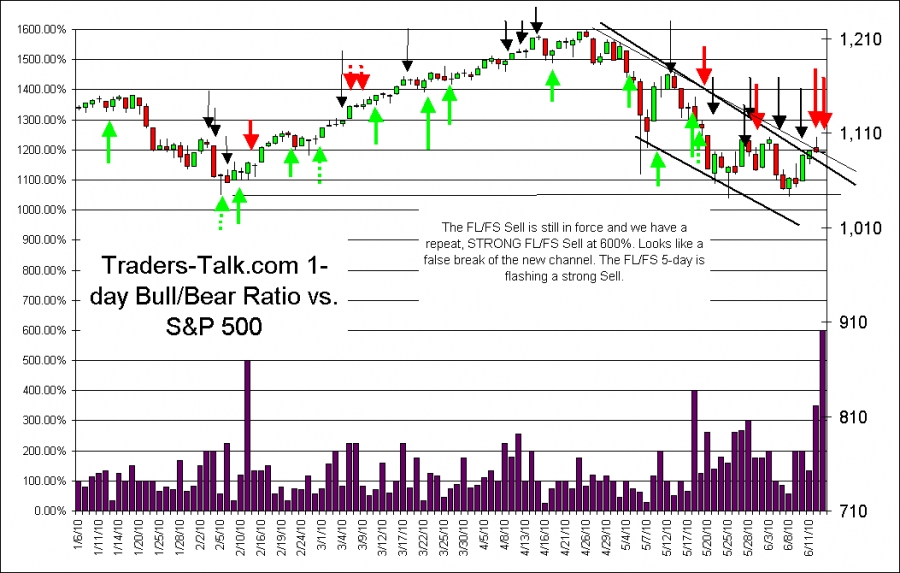
Nasdaq newsletter writers are very Beared-up at 53% short. The FL/FS is flashing a strong Sell at 600%. Very mixed signals. We still have a "Best Fade" Sell.
********************************************************
Message Board Sentiment
The message board sentiment poll shows Bulls at 45% and Bears at 25%. This is technically Bullish since this crew tends to be right, at least for a bit, but there are few Bears and a lot of Bulls... Participation was below normal. The Actual Position Poll has 30% fully long and 15% partially long. 25% are partially short and 5% are fully short. This is WAY below my 20% threshold and is Bearish for the market. The FL/FS Sell was good for a trade and now we have a very strong repeat FL/FS Sell (at 600%). This is pretty excessive and ought to bring some selling today or tomorrow. The 5-day Fully Long/Fully Short (FL/FS) ratio is very high and Bearish.
Check out www.traders-talk.com for early updates of the sentiment polls every day and overnight.
Our T-4 Turn Indicator went out at 40, which is away from a signal. Typically we want to see readings above 70 or higher (now that we've made changes to the posting guidelines). This indicator doesn't catch every top and bottom, but it is a great "Heads up!" indicator.
Options Sentiment
Daily P/C ratio: 1.10. Constructive.
10-day P/C ratio: 1.02. Constructive.
Equity P/C ratio: 0.59. Neutral.
OEX PC ratio (not a fade): 1.20. Neutral.
OEX 10-day PC ratio: 0.99. Constructive.
OEX $-weighted* P/C ratio: 3.22. Buy.
NDX $-weighted* P/C ratio: 0.26. Sell.
QID (Ultra Short QQQQ) P/C ratio: 0.26. Neutral.
SDS (Ultra Short SPX) P/C ratio: 0.25. Neutral.
ISEE Sentiment Index: 84. Positive.
10-Day ISEE Sentiment Index: 93. This is Bullish. (H/T to persistent subscriber)
Relative VIX: Neutral.
Daily VIX: Sell.
The P/C data is pretty mixed, but generally constructive. Of course, this is options expiration week. The $-weighteds are mixed and I note that the RUT is flashing a sell too. The VIX is still suggesting motive to take the market down. Market Harmonics' Options Buyers Sentiment Gauge (thank you, Tony Carrion http://www.market-harmonics.com) is neutral.
Most options indicators are contrary; if most folks are buying calls, we want to fade them and go short and vice versa. The OEX nominal P/C is an exception, because the OEX traders tend to be right, unless they are paying up for options (which will show up in the $-weighted data).
The ISEE Sentiment Index indicator is contrarian; traditionally, over 200 is too optimistic, under 100 is too pessimistic. *$-weighted P/C data courtesy of Fari Hamzei of www.hamzeianalytics.com . Readings over 2.0 are Bullish and near 0.5 are Bearish. OBSG provided by Tony Carrion of Market Harmonics.
General Public Polls
The Newsletter Advisors turned more Bullish rising to 13.1% net net long from -8.8% net short last week. This is OK, and not actionable. Naz advisors fell to -53.6% net SHORT from -19.6% net SHORT. That's a BIG increase in Bearishness and is consistent with a better low.
Last week, TSPTalk reported 49% Bulls and 40% Bears, vs. 50% Bulls and 42% Bears last week. That's a Buy by their new measures, and that's neutral by mine. Frankly, I think they are a little to accepting, Thursday's rally notwithstanding. They are now using their Bull Market Filter and it has been doing pretty darned well for them. I'm using a faster trend filter.
National Association of Active Investment Managers (NAAIM) Sentiment Survey reported that the Median market exposure rose to 30.00% from 27.50%, which is still near, but moving away from an Interm-term Buy (below 20%). That's not actionable, but I don't like it. The maximum short exposure of fell to -125% from -200%.
For more on our analysis, see this brief study http://www.traders-talk.com/mb2/index.php?showtopic=115139.
AAII reported 34.48% Bulls and 43.10% Bears. That's a drop in Bullishness and a drop in Bearishness. We are still in Buy territory. Last week, we had 37.9% Bulls and 47.85%.
Investors Intelligence reported 38.5% Bulls and 31.9% Bears vs. 39.8% Bulls and 28.4% Bears last week. That's a small drop in Bulls and a decent jump in Bears. This is not yet Bullish, but it's getting there.
Lazlo Birinyi's site, Tickersense, reported 43% Bulls and 21% Bears vs. 43% Bulls and 36% Bears the prior week. That's flat Bulls and a nice drop in Bears. That's still probably more Bullishness and much less Bearishness than we'd like to see.
RealMoney Poll is not available currently.
Conclusion
Last time, we said that while things keep looking a little bit better, we had a "Best Fade Sell" from the MACD and a FL/FS Sell signal. We were looking for some selling early, thanks to that. Today, we've got some really mixed readings. First and foremost, the FL/FS is at 600% which is a very strong Sell and the 5-day is also quite high. That may put a cap on a rally. The options are very odd. The VIX is saying "Sell" but the $-weighted OEX is saying buy. And then the Naz and Rut options are saying "Sell". If it weren't options expiration, we'd be confused. As it is, we'll just ignore those readings, save for the best, which is the VIX. That's modestly Bearish for the market. On the Bullish side, however, we've got Nasdaq newsletter writers very Beared-up at 53% net short. So, while I'm looking for some selling, I'm thinking that we need to start nibbling long wherever we can. Technicals are improving.
We are on twitter and we offer comments and trade updates throughout the day as we have time or as we see sentiment of interest. You can follow us at http://twitter.com/WallStSentiment .
The Mechanical Senticator Model and the Subjective Model took a 1/2 long position at 110.53. Crummy execution. We may add. Remember, these models must trade in the direction of the Senticator or not at all. In case you haven't been keeping track, we just figured that the Senticator has outperformed the market by 58% over the past 3 3/4 years--that's with no leverage and few shorts.
We are looking both ways, but mostly south. Since we've been publishing our ST Sentiment Signals, we've had 160 trades and 105 winners. If you'd like a trial, feel free to contact us ( http://www.wallstreetsentiment.com/contact.html).
****************
Ideal ETF Portfolio (tracking portfolio):
25% QLD at 34.30
50% QID at 33.21
25% QLD at 26.09
Look to take off part of the hedge. We'll advise.
*******************************************************
Past performance is no guarantee of future returns. All information included in this missive is derived from sources we believe to be reliable, but no guarantee can be made to that effect. None of the forgoing should be construed as an offer or solicitation to buy or sell any security. The publisher may have a long or short position in the funds or securities discussed at any given time. We aren't your advisor, unless you have a signed contract with us. Please review any trade that you do with your trusted advisor FIRST.
---------------------------------------------------------------------------------
Note that we are publishing on our private area on Traders-talk.com, providing on-line access to our charts and research. The password is at the top of this letter. http://www.traders-t...hp?showforum=47
(you'll need to register and sign in on Traders-talk and you'll need an additional password to access the board. If you are a subscriber and you do not have a password, please contact us).
For more on using Wall Street Sentiment and the various sentiment data included, click here:
http://www.WallStreetSentiment.com
Mark Young
Editor
859-393-3335
818-MARKETS


