


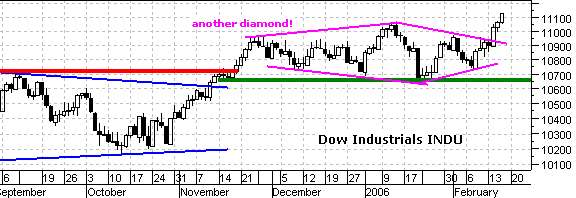
The Dow started it all with a diamond breakout this past week andmove to a 4 1/2 year high. In addition, the Dow Transports is trading at an all time highand this puts Dow Theory in bull mode, unless of course you are Richard Russell. I havegreat respect for Russell and have read him on and off for the last 25 years. However, Ithink new highs in the Dow Industrials and Dow Transports are a show of strength, notweakness.
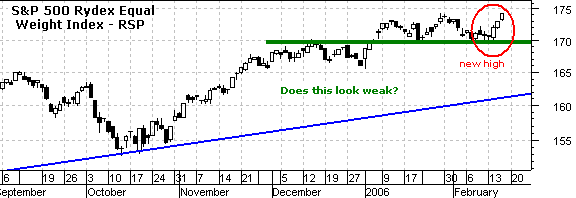
There is certainly plenty to be worried about on Wall Street. Wehave a new Fed chairman, Iran is acting up, Hamas is running Palestine and the deficitsare spinning out of control - just to name a few. Despite all this negativity, the S&P500 Equal Weight Index (RSP) closed at a new all time high on Thursday. Is what a weakmarket looks like? I don’t think so. I want to see evidence of weakness beforegetting worried.
***Major Indices***
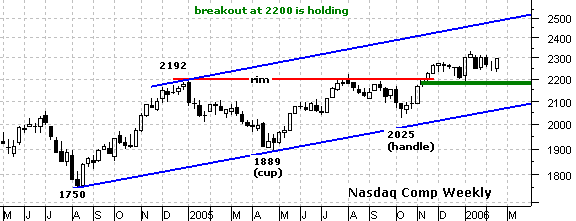
Let’s take a step back and look at some weekly charts for themajor indices. My stance on the Nasdaq turned bullish on 11-Nov-05 at 2200 and remainsbullish with an upside target above 2500. This target stems from the rising price channeland the cup-with-handle breakout. I first noted the cup-with-handle pattern in Novemberand subsequent price action has done nothing to refute this pattern. The index broke rimresistance in November and pretty much consolidated the last 3 months. Broken resistanceturned into support and this substantiates the pattern. A consolidation above resistanceis bullish and I would expect a continuation higher in the coming weeks. The upper channeltrendline extends above 2500 and the cup-with-handle target is to around 2500 as well(2192 - 1889 = 303, 2192 + 303 = 2498). As long as the January low holds, there is noreason to doubt this projection.
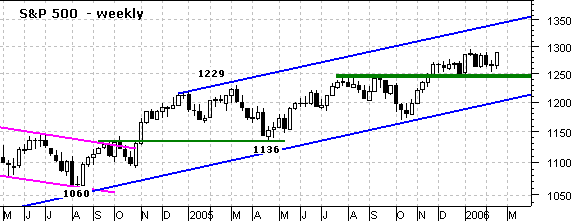
My stance on the S&P 500 turned bullish on 18-Nov-05 andremains bullish. Like the Nasdaq, the index broke resistance and broken resistance turnedinto support. After a surge above 1250, the S&P 500 consolidated the last three monthsand this reinforces support. There is a clear rising price channel in the works and theupper trendline extends to around 1350 over the next few weeks. The index surged offsupport for the second time this year and a run to the upper trendline makes sense. Afailure and move below the January low would turn this bullish forecast on its head.
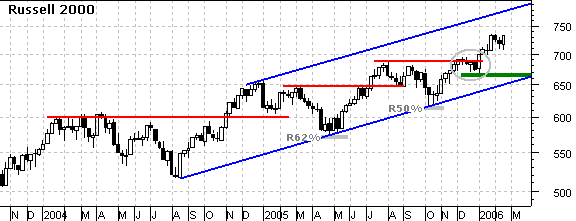
The Russell 2000 ($RUT) remains the boss. This index has steadilyoutperformed the Nasdaq, S&P 500 and Dow over the last few years. While the Dow hadits moment in the sun this week, I still expect the Russell 2000 to catch-up and continueoutperforming. The index consolidated in December (gray oval) and broke resistance inJanuary. While the other majors corrected from mid January to mid February, the Russell2000 held relatively firm and the upside target is around 800 (upper trendline of therising price channel). I am watching broken resistance at 700 for signs of trouble and keysupport at 660 for a major trend reversal.
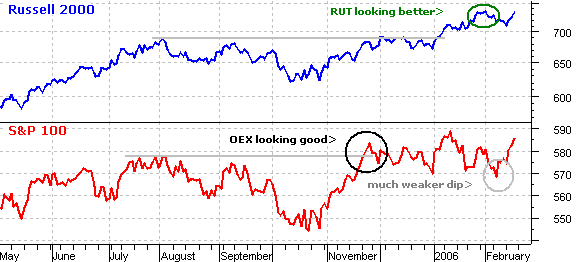
Are large-caps destined for better days? This simple chartcomparison offers little evidence, if any, that large-caps are about to startoutperforming small-caps. The top plot (blue) shows the Russell 2000 ($RUT) and the bottomplot (red) shows the S&P 100 (OEX). OEX took the lead at the end of November (grayoval) with a break above the summer highs. This outperformance did not last long though asOEX moved into a trading range and RUT surged to new highs by the end of January (greenoval). In addition, the S&P 100 even broke its December low in early February. OEX hassince recovered, but has yet to overtake RUT and small-caps continue to dominate. The morethings change, the more they stay the same.
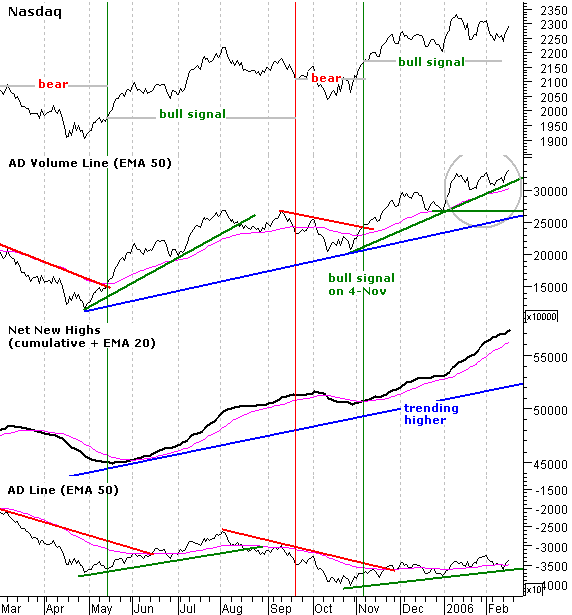
You can tell a lot from someone’s breadth. Good breadth is ahealthy sign that does not turn people off. In contrast, bad breadth is a sign ofsickness, stress or an upset stomach. It turns people off. Market breadth is the same way.It tells us what is going on deep inside the market and I use these indicators to sniffmarket breadth. I use the AD Volume Stats, Advance/Decline Stats and Net New Highs. Withthree, it is easy to strike a majority (2 out of 3) and define breadth as bullish orbearish. The Advance/Decline Stats have been lagging for months, but the AD Volume Statsand Net New Highs have been moving higher and are clearly bullish. The AD Volume Line andthe Cumulative Net New Highs line both moved to new highs this week. This is not a sign ofweakness or poor health. This is a sign of strength and good health. The AD Line remainsbelow its late January high, but two of the three are firing strong and this is enough forme.
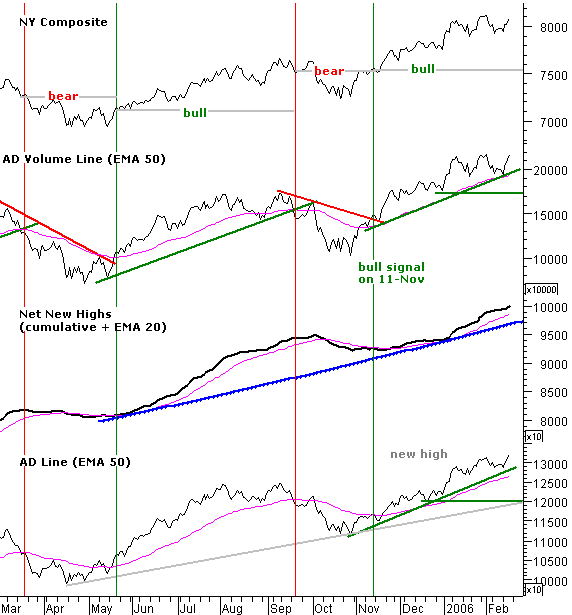
NYSE breadth remains strong as well. A bull signal was triggeredin November and it has been nothing but net ever since. The AD Volume Line, AD Line andCumulative Net New Highs line all moved to new highs this week. This is on the heels of astrong Finance sector. There are numerous regional banks and the Finance sector accountsfor around 20% of the NYSE. This interest rate sensitive sector carries a lot of weight inthe index and the breadth stats. I will be watching the late December lows for signs ofweakness and a potential trend reversal in stocks.
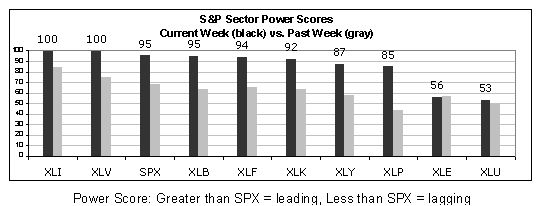
One look at the sector histogram shows us why breadth remainsstrong. The current Power Scores (black bars) are much higher than last week’s PowerScores (gray). Seven of the nine sectors have Power Scores above 80 and there was strengthacross the board over the last five trading range. The Energy SPDR (XLE) and the UtilitySPDR (XLU) are the weakest sectors, while the Industrials SPDR (XLI) and HealthCare SPDR(XLV) are the strongest sectors. The other five sectors are somewhere in between, butleaning towards the strong end of the histogram. Broad strength is healthy for the S&P500.
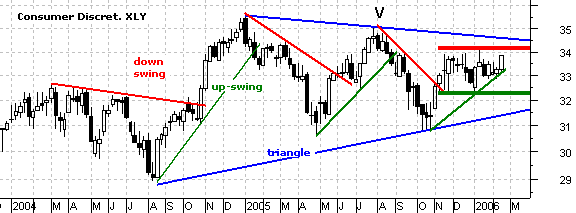
I am still waiting on the Consumer Discretionary SPDR (XLY) for abreakout and get this rally moving though. This key index remains below its Jan-05, Jul-05and Jan-06 highs. Actually, I would be happy with a break above the Jan-06 high and moveabove the upper triangle trendline. This would turn XLY bullish and further the bullishcase for the broader market. Right now, XLY is lagging and it is a concern when thiseconomically sensitive sector lags. A move below the December low (say 32) would be mostbearish for the sector and the market overall.
***Tech Groups***
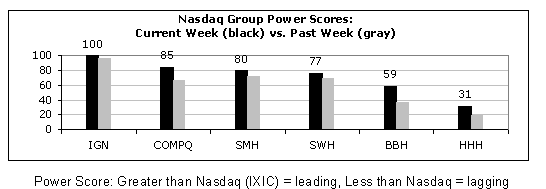
While the sector picture shows overall strength, the Nasdaq grouppicture is more mixed. The Networking iShares (IGN) is the clear leader and showing goodstrength. The Semiconductor HOLDRS (SMH) and Software HOLDRS (SWH) are holding supportlevels, but have not advanced the last few weeks and are not outperforming the Nasdaq. TheBiotech HOLDRS (BBH) and Internet HOLDRS (HHH) remain down in the dumps and are bothlagging the Nasdaq.
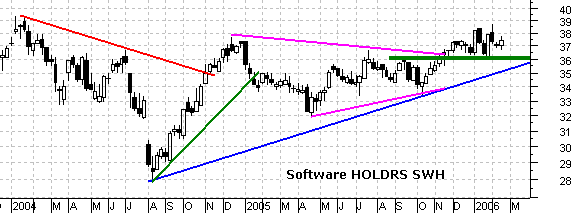
The Software HOLDRS (SWH) and Semiconductor HOLDRS (SMH) hold thekey to the Nasdaq. These are the swing votes that could go either way. Both are tradingabove support from the early January lows and must hold these lows for the tech bulls toprevail. SWH broke triangle resistance and is holding this breakout. Like the Nasdaq,broken resistance turned into support and this level holds the key (36) for the bulls.
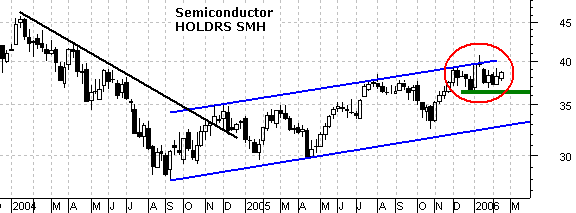
The Semiconductor HOLDRS (SMH) does not have a clear resistancebreakout, but there is a clear rising price channel and clear support level just above 36.First, the rising price channel provides a nice tail wind for the bulls. Second, the stockis consolidating near its highs (red oval). Third, consolidation support is holding andthere have been two bounces around 36-37. As long as consolidation support holds, thebulls have nothing to worry about and further gains can be expected. A move below theJanuary low would break support and signal a big failure at resistance. As pointed outlast week, the pattern since December looks like a head-and-shoulders reversal. However,keep in mind that this is UNCONFIRMED and it would take a break below 36 to confirm. Ihave see plenty of potentially bearish head-and-shoulders reversals hold support and neverconfirm.
***Intermarket***
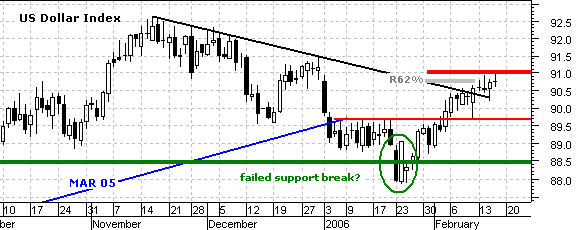
My stance on the US Dollar Index turned Bearish on 24-Jan-06 at87.95. The index recovered from its support break and surged above 90 the last few weeks.The index stalled the last five days and this is the moment-of-truth. The advance retraced62% of the prior decline and is stalling just below the December high. Further strengthabove 91 would show too much strength to justify a bearish stance and I would then changehorses. Look for a move below 89.5 to signal a peak around 91 and start a new leg lower.
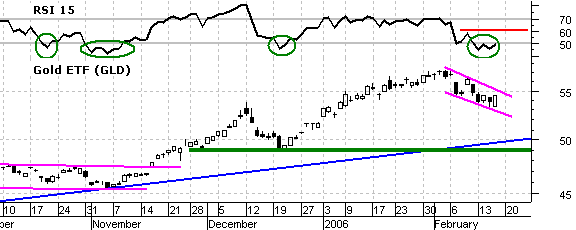
My stance on GLD turned neutral on 10-Feb-06 at 55. I still thinkthe long-term trend is bullish for gold, but a correction is unfolding and furtherconsolidation or downside is likely before the uptrend resumes in earnest. Having writtenthat, I do notice that the last three lows occurred when RSI dipped below 50 and backabove (green ovals). In addition, the current decline looks like a falling wedge or flag,which is a bullish corrective pattern. A move above 55, which is happening right now,would signal a continuation higher. The bullish setup is there, but I see lots ofresistance above 55 and would expect quite a battle in this area.
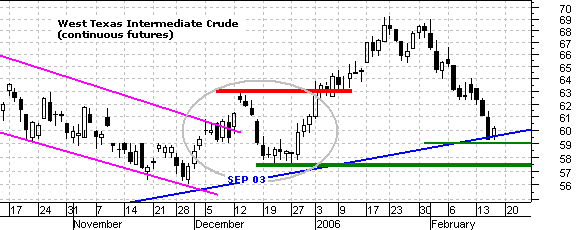
My stance on oil turned bullish on 15-Dec-05 at 60. Despite thesharp decline over the last few weeks, my stance remains bullish as oil trades nearsupport around 60. I will not tolerate much more weakness though. Support around 60 isconfirmed by the Sep-03 trendline and the December consolidation (gray oval). The declinewas quite sharp and not the stuff of a normal correction. However, before turning bearish,I need to see some technical damage to the current uptrend. WTIC formed a lower high justbelow 70, but has yet to break a key trendline or form a lower low. This one merits aclose watch at the moment and further weakness would be bearish.
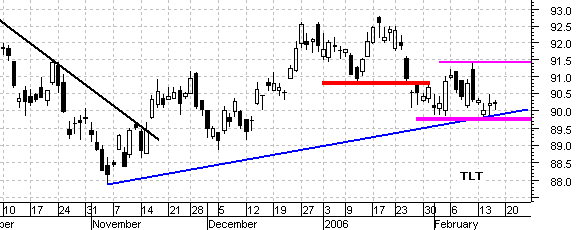
My stance on the TBond ETF (TLT) turned bullish on 3-Jan-06 at 92.Is the battle for 90 over yet? Just when it looks like TLT is going to break support andmove lower, it recovers and closes just strong enough to keep support at 90 alive. Insteadof a gap down (last Friday), the bond ETF gapped higher today and is trading around 91.This reinforces support around 90 and keeps my stance bullish. A move above 91.5 wouldfurther validate my stance and argue for lower rates (higher bond prices). Key support isnow based on this week’s low and set at 88.7.
Model Portfolio
The current advance began in mid October and is now 3 1/2-4 monthsold. While not that old overall, there are pockets of weakness that keep me hesitant tojump in (Consumer Discretionary). The leaders are falling (GOOG, AAPL) and the retailstocks continue to lag. This is not the ideal time for long positions and I will remain onthe sidelines.
ModelPortfolio Notes:
L = LongPosition, S = Short Position, Qty = quantity of shares, REC = Re-evaluation close (closebelow REC for longs and close above REC for shorts), SL = stop-loss. This is ahypothetical portfolio based on even dollar amount of $10,000 per position. $20 wassubtracted to cover round trip commissions. This portfolio is meant for educationalpurposes and should not be considered a recommendation or solicitation to buy, sell orshort these securities.
about:
The TDTReport consists of a brief update on Tuesdays and a full report on Fridays. For shortenedweeks (4 days or less), there will only be one report on the last day of the week. Changesto the Model Portfolio and major indices are sometimes necessary between scheduled updates(Tuesday and Friday). As such, additions, deletions and/or updates to the Model Portfoliomay sometimes be emailed between reports. These will also be added to the website.
Disclaimer:
ArthurHill is not a registered investment advisor. The analysis presented is not a solicitationto buy, avoid, sell or sell short any security. Anyone using this analysis does so at hisor her own risk. Arthur Hill and TD Trader assume no liability for the use of thisanalysis. There is no guarantee that the facts are accurate or that the analysis presentedwill be correct. Past performance does not guarantee future performance. Arthur Hill mayhave positions in the securities analyzed and these may have been taken before or afterthe analysis was present.
PowerScore:
The PowerScore (PS) is based on absolute strength and this can be compared against other securitiesfor an idea of relative performance. The Power Score (PS) measures the strength of aparticular security for a given time frame: 20-day, 60-day, 120-day and 250-day. These aretrading days and roughly equate to 1, 3, 6 and 12 month periods. A weighted average of thefour Power Scores is then calculated with 12-months weighing the most and the 1-monthweighing the least. In general terms, readings above 55 are bullish and readings below 45are bearish. The zone between 45 and 55 is a transition area that can go either way.
About Arthur Hill


