Timer Digest" has Tim Ord ranked #5 for one year ending 6/3/05 and #1 in Gold for one year ending 1/13/06.
For 30 to 90 days horizon: Short SPX on 1/20/06 at 1261.49. Short Nasdaq on 2/17/06 at 2282.36.
Monitoring purposes XAU: Long XAU, 129.56 on 12/29/05.
Longer Term Trend monitoring purposes: flat.
We have "800" phone update that cost $2.00 a min. and billed to a credit card. Call (1-970-224-3981) for sign up. We update Eastern time at 9:45; 3:15 and 4:00. Question? Call me (402) 486-0362.
What to expect now:
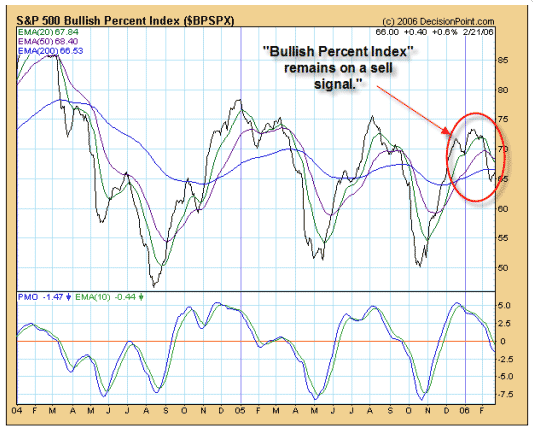
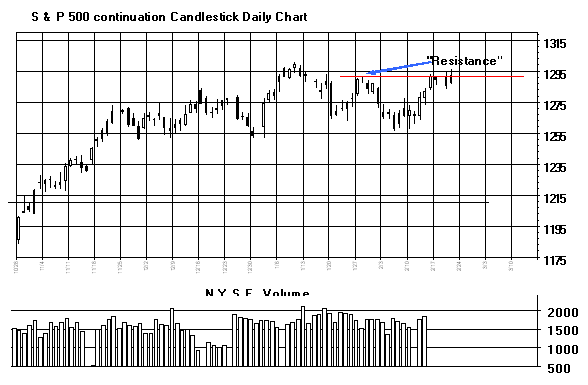
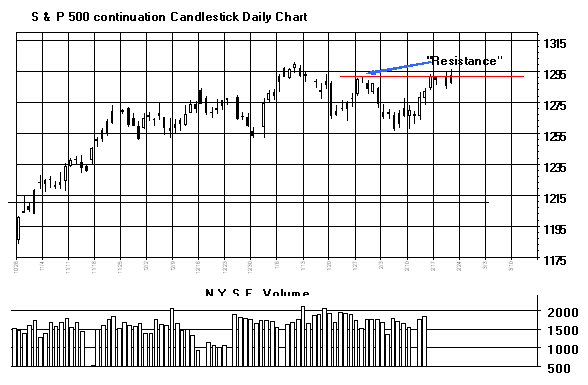
Below we have displayed the "Bullish Percent index" for the SPX, (Courtesy of www.decisionpoint.com). We have updated this chart to yesterday close. The "Bullish Percent Index" measures the percent of stocks in the SPX that are on "Point of Figure" buy signal. Officially for a sell signal to occur this index needs to trade above the 70% range and then close below it. An early warning sell signal is triggered when a market trades above the 70% range and then closes below the 20 EMA. This condition appeared a couple of weeks ago. Yesterday, we mentioned the possibility that a “Head and Shoulders” topping pattern may be forming where the January 11 high is the “Head”. This pattern may still be forming as long as the “Head” is not touched. However, if the “Head” is tested and tested on Lighter volume, then the whole pattern turns into a “Double top” and still bearish. Since the “Bullish Percent Index’ on the SPX remain on a sell signal, we are holding our short position. We are short on 1/20/06 at 1261.49.
To learn more on "Ord-Volume" visit www.ord-oracle.com
Nasdaq Composite:
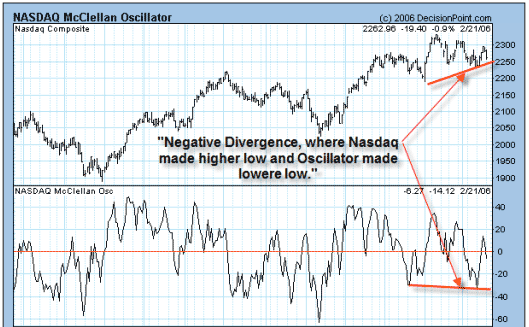
Below we have displayed the Nasdaq McClellan Oscillator and Summation index, (Courtesy of www.Decisionpoint.com). A negative divergence was produced when the Oscillator made a lower low in mid February then the previous low in mid December and the Nasdaq made a higher low in those same time frames. This condition shows that few stocks are holding up the market and a bearish sign. On the McClellan Summation index, we have circle and area. This circled area appears to be a “Ledge” formation. “Ledges” are hesitation in the Summation index. To form a “Ledge” the McClellan Oscillator must trades around the “0” line. When the Oscillator is trading near the “0” line the advance/decline line is usually at a balance. When the pattern breaks out of the “Ledge” formation, a selling impulse begins (in cases where “Ledges” form in a downtrend) that may last a week or so. Therefore, according to the Summation index “Ledge” pattern, a possible strong move to the downside could start at any time. We are short the Nasdaq at 2282.36 on 2/17/06.
"Timer Digest" has ranked Tim Ord as the #1 gold for one year ending 1/13/06.
Gold Market:
Short term trade, Long BGO (4/19/05) at 2.37. This trade is separate from our long-term position in BGO. We bought EGO (gold Issue) at 2.23 (5/26/05). Sold 10/20 at 2.92 for 31% gain. We bought PMU (5/27/05) at .50 and bring our average price to .81. Long TRE at 2.55 on 11/1/05, sold at 3.39 on 12/3/05 for 33% gain. Long NG at 8.47 on 11/2/05, Sold at 9.20 on 11/30/05 gain of 9%. Long DROOY at 1.27 on 11/9/05, sold at 1.89 on 1/19/06 for 49% gain. Bought AGT at .33 on 2/1/06.
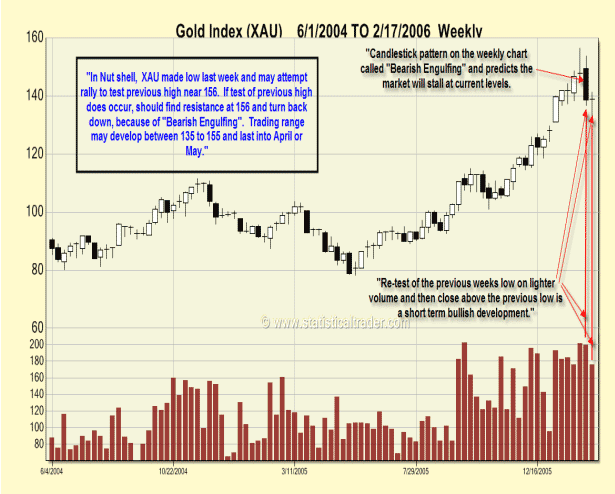
We have talked about the Bullish pattern on the XAU called "Third Time Up". This pattern predicts the market will exceed the previous two highs on the third test of those highs. Normally a market will build a trading range on the test of the third time to build energy to break resistance. The XAU is in the process of building that trading range now. Since the "Third Time up" is on a monthly chart dating back to 1987, the trading range may take several months to complete. On the XAU chart below, we took a smaller time frame to see what the shorter term time frame is saying. In a “Nut Shell”, the XAU made a low last week on lighter volume then the week before and then close above the previous low signal a short term bullish sign. This bullish sign may lead to a rally that may test the previous high near the 156 range. Since the XAU drew a “Bearish Engulfing” pattern (see chart) the 156 range should find resistance and a pullback should start. The downside target on this potential pullback would be the previous low near the 135 range. If the 135 range is tested on lighter volume again, then that area will act as support and the XAU will attempt a rally again. In general we think a trading range will develop between 135 to 155 and last into April or May.
We double our positions in BGO on (7/30/04) at 2.34 and we now have an average price at 2.70. Long CBJ for an average of price of 2.75. Long NXG average of 2.26. We bought PMU (5/27/05) at .50 and bring our average price to .81.
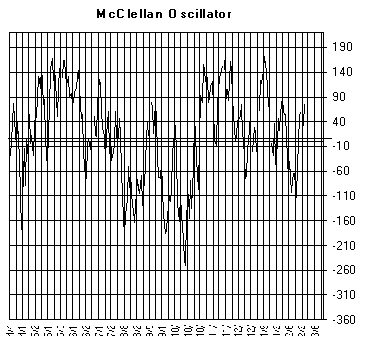
The McClellan Oscillator closed today's at "77" and neutral.
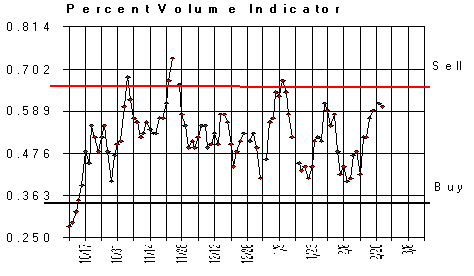
The “Percent Volume” Indicator closed .60 and neutral.
The "5 day ARMS" closed today at 5.10 and short term bullish.
Conclusion: Short SPX at 1261.49 on 1/20/06, Short Nasdaq on 2/17/06 at 2282.36.
Longer Term Trend monitoring purposes: Flat.
