
(This is an excerpt from May 20, 2011 issue of the blog for Decision Point subscribers.)
A reader recently called me a perma-bull, which is amusing, since by nature I'm usually disposed toward bearishness. I will, however, remain bullish until our mechanical timing model switches from a buy. The model will be bullish until the 20-EMA for the S&P 500 crosses down through the 50-EMA. We can see on the chart below that those moving averages are converging, but there is plenty of room before a crossover will take place.
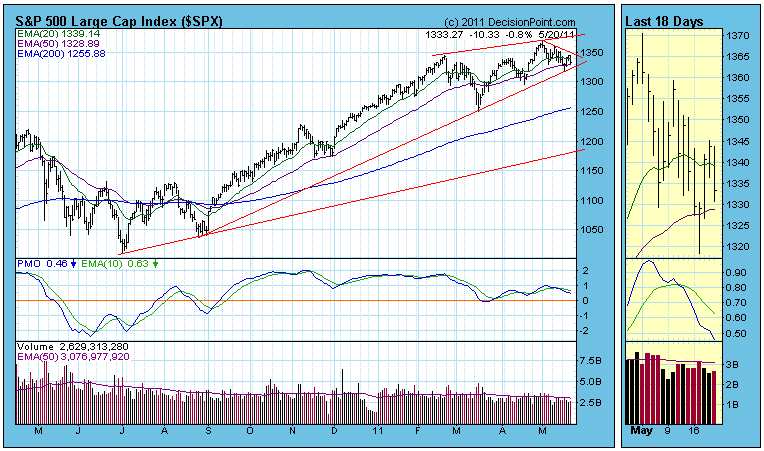
While the model provides discipline, we are still permitted to look at indicator charts and speculate about the future. For example, on the chart above we can see a rising wedge pattern, which is a bearish pattern that usually resolves to the downside. There is still room and time for prices to bounce around inside the wedge, and the rising trend line is still holding, so this is not strongly conclusive.
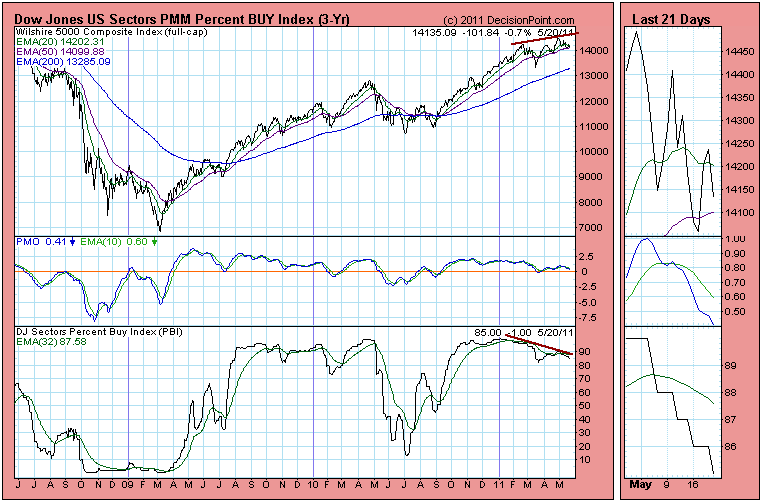
Below is a Percent Buy Index (PBI) chart for the broad market. It shows the percentage of buy signals for the 100 Dow Jones market sectors. While it is still at a relatively high reading, there is a negative divergence between the PBI and the price index. This shows that the price advance is being undermined because fewer sectors are participating.
The next chart is the weekly bar chart of the S&P 500 Index. The concern here is that the weekly PMO has topped and is falling below its EMA (green line). There is also a negative divergence between the two PMO tops and the price tops. This is really bearish.
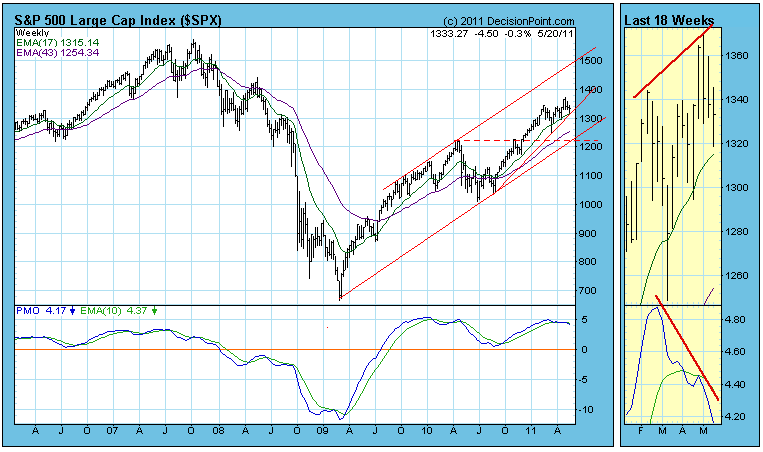
Bottom Line: The S&P 500 has not yet given the fatal sign of breaking down through the rising trend line drawn from the August 2010 low, but there are internal indicators that are giving strong evidence that an important top may have been made on May 2. That is to say that we could have begun a substantial correction, or the bull market may be over.
* * * * * * * * * * * * * * * * * * * * *
Technical analysis is a windsock, not a crystal ball.
* * * * * * * * * * * * * * * * * * * * *
Carl BIO: Carl Swenlin is a self-taught technical analyst, who has been involved in market analysis since 1981. A pioneer in the creation of online technical resources, he is president and founder of DecisionPoint.com, a premier technical analysis website specializing in stock market indicators, charting, and focused research reports. Mr. Swenlin is a Member of the Market Technicians Association.
* * * * * * * * * * * * * * * * * * * * *


