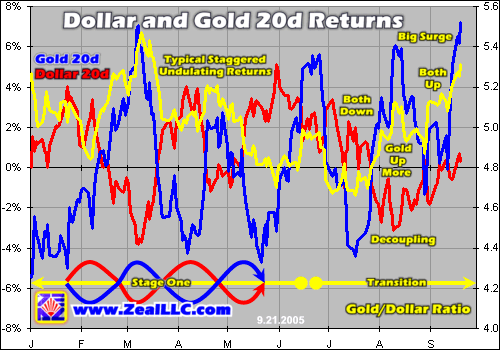
that chart also supports a fake out D up with a E down to come as a possibility. we are closing just above your line but that matter slittle yet unless we see soe hard up here which I doubt...so, if we get some more down inside of that, one has to wonder: should I sell as it could be that dreaded E, or is a fake out with the BO about to come?
Dougie, I have thought of that so, so much -- the "fake-out" D. And there is risk here -- yes, it could be a "bull trap," or "false breakout," etc. The public has woken up (to some extent) to gold, and so this stuff bears thinking about.
"D" would already be almost exactly as long as "B," here, and D's normally are shorter, so that makes me doubt the ABCDE in progress count, for now. The indicators I watch look similar to the May-October period in 2004, so I don't know what the heck....
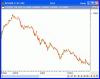
From the May 2005 low, I think the HUI looks decent for
123.. -- with
1 and
2 being done at the July low, and then 1 of
3 and 2 of
3 being complete at the late August low. So, we'd be going up in 3 of
3 now.
This could also be 3 of
C, within the still-possible triangle. If all we do is finish up the move from this year's low in an overall three-wave pattern, and turn back down, then it could be in "E."
In months past, due to what I perceived as a bull move in the US Dollar, I doubted gold's bullishess, but now the chart action has forced me to reconsider. Long-term, even if we have that E wave to come, after that gold and the mining stocks should
roar, so waiting around until one sees the "perfect" Elliott Wave count/low-risk situation may be fruitless. Either sooner or later, in my opinion, this bad boy is going to do that Blast Off.
For now, I think the question is are we making three waves up from May 2005, or five?
Best,
Doug