From the webcast of 7/11 ...Merriman had thought we would see a big move in metals into the Cardinal Climax especially during the Mercury Sagitarius period July 23-Aug 2 where typically 6-9 days it skyrockets...65% of the time..as I mentioned before there is 20% of the time it goes down and the other 15% it goes mildly up. He did point out that if 1168 is taken out then that he would be wrong and it would be bearish and it could mean
central banks are liquidating their holdings of gold into the first week of August which coudl quickly drop gold between 950-1050..(although that was not his preference and doesn't expect it to go under 970). So, now that we broke 1168, if we take out especially 1130 then that would be exactly what is happening according to Merriman.
He is expecting a 22 month low in gold due between now and January 2011. July 30-Aug 1 plus/minus 3 days is a reversal period which would have began yesterday. Yesterday we did reverse hard even though gold didn't really go up as much as silver from it's bottom last week. I would have to assume that fits in the period of a reversal because we have broke under 1168 and it's having a hard time recovering.
I did well on my silver trade buying near its lows last week and selling Monday when I noticed the difficulty it had trying to fill its gap to 17.93 and knowing a reversal period is coming up. I think no matter what we all think about the gold/silver right now, there is a big opportunity that should come in August to buy it for a good trade especially long term imo.
Silver could drop really big if it closes Friday under17.38 which is the weekly 50 MA. Last time it did that was Jan/Feb and it was a bottom for the year. The weekly channel on silver is getting narrow just like Jan/Feb. If silver closes Friday under 17.57 it would be also negative on the monthly 8 ema which has been a good guide for trend. Same goes for gold on the monthly 8ema. Under 1151.80 is breaking that trend. So I would be watching how Friday closes imo
Just thought I'd add back the bearish argument Merriman had if 1168 did break which was disclosed earlier.
Good luck and good trading.
TM

Merriman Update now that 1168 broke
Started by
tradermama
, Jul 28 2010 06:35 AM
17 replies to this topic
#2

SilentOne
-

- Traders-Talk User
- 3,452 posts
Member
Posted 28 July 2010 - 08:22 AM
hi tradermama,
The significance of 1168 from a cycles point of view is as follows:
Yesterday gold took out the May 17th lows which I have as the last 15 week low, a bearish event for the current 15 week cycle. Also the last 7/8 week low was violated. The current 15 week cycle is in its 11th week, so we are likely at least four weeks from a primary cycle low and the next 15 week cycle low.
cheers,
john
Edited by SilentOne, 28 July 2010 - 08:23 AM.
"By the Law of Periodical Repetition, everything which has happened once must happen again and again and again-and not capriciously, but at regular periods, and each thing in its own period, not another's, and each obeying its own law ..." - Mark Twain
#3
tradermama
-
- Traders-Talk User
- 909 posts
Member
Posted 28 July 2010 - 08:26 AM
Thanks John...this could go in line with Aug 21st reversal turn date..plus/minus 3 taking it to the 24th..4 weeks is the 25th of Aug...hi tradermama,
The significance of 1168 from a cycles point of view is as follows:
Yesterday gold took out the May 17th lows which I have as the last 15 week low, a bearish event for the current 15 week cycle. Also the last 7/8 week low was violated. The current 15 week cycle is in its 11th week, so we are likely at least four weeks from a primary cycle low and the next 15 week cycle low.
cheers,
john
#4
Ken
-

- Traders-Talk User
- 160 posts
Member
Posted 28 July 2010 - 08:30 AM
Hi tradermama,
I don't know how all of this will play out but here's my take on Merriman's analysis.
Merriman was bullish on gold and thought gold could skyrocket to over $1,300 during the first week of August as long as gold didn't trade below $1,168 this week. Well, gold traded below $1,168 yesterday so that rules out Merriman's idea of gold skyrocketing to over $1,300 next week. However, gold is currently falling hard and there's a critical reversal date this weekend on July 31st - August 1st. In addition, heliocentric Mercury enters Sagittarius from August 2nd to 12th. According to Merriman, when heliocentric Mercury enters Sagittarius 65% of the time gold skyrockets, 15% it moves up modestly and 20% of the time it falls hard.
I'm thinking that gold won't move up above $1,300 now that it has traded below $1,168 but it could still have a nice move up next week if gold continues to decline the rest of this week. In fact, if gold makes a lower low this week on Friday I'd be willing to bet that would be a good short-term buying opportunity with the critical reversal date on July 31st-August 1st and heliocentric Mercury entering Sagittarius from August 2nd.
Also, it's not surprising gold and silver began to decline from Tues, July 27th because Merriman had July 26th and July 27th as reversal dates for silver in his MMA Gold & Silver Weekly Comments and Trade Recommendations.
Ken
#5
tradermama
-
- Traders-Talk User
- 909 posts
Member
Posted 28 July 2010 - 08:54 AM
.
Ken
Thanks Ken. In his forecast book he has July 30-Aug 1 plus/minus 3. Sometimes I can have a hard time figuring are we going down into it or up and reverse...because of this plus/minus 3.  I dont subscribe to his weekly gold/silver column. I wonder if that would trump the forecast book or if that window can still be open? He did say as long as 1130 holds then it can still be going up too. In the webcast he spoke that gold is due to bottom (preference 1126-1155) if we are in a new cycle which was his preference or if this is an older cycle it would be going down further which I thought it was based on breaking the 1168 to determine what cycle it was. Did he mention anything about that with a target? I might listen to the download webcast one more time to make sure I wrote this down correctly. But for now, I"m just using TA and will go by how Friday's close will look too.
Imo, gold and silver actually declined early July but yesterday had a big drop. I would think a bounce is coming too especially off the 200 day which is 1145.16...so we are not that far away... but 1210 area seems strong resistance now. Also, on the daily gold is now under the 125 ma which is a first since March fwiw.
Keep posting updates. It's appreciated.
TM
[/quote]
I dont subscribe to his weekly gold/silver column. I wonder if that would trump the forecast book or if that window can still be open? He did say as long as 1130 holds then it can still be going up too. In the webcast he spoke that gold is due to bottom (preference 1126-1155) if we are in a new cycle which was his preference or if this is an older cycle it would be going down further which I thought it was based on breaking the 1168 to determine what cycle it was. Did he mention anything about that with a target? I might listen to the download webcast one more time to make sure I wrote this down correctly. But for now, I"m just using TA and will go by how Friday's close will look too.
Imo, gold and silver actually declined early July but yesterday had a big drop. I would think a bounce is coming too especially off the 200 day which is 1145.16...so we are not that far away... but 1210 area seems strong resistance now. Also, on the daily gold is now under the 125 ma which is a first since March fwiw.
Keep posting updates. It's appreciated.
TM
[/quote]
#6
Ken
-
- Traders-Talk User
- 160 posts
Member
Posted 28 July 2010 - 09:10 AM
Hi tradermama,
In Merriman's most recent MMA Gold & Silver Weekly Comments and Trade Recommendations (July 26) he specifically stated that a weekly close below $1,175 would suggest that gold has topped out and it may be down from here into mid-December with a price target range of $975 to $1,060. He told his subscribers to buy if gold falls between $1,173 to $1,181 with a stop-loss at $1,167. Well, those stop losses of $1,167 would have been hit yesterday so I don't know what Merriman is thinking in the short term.
By the way, I also watched Merriman's July 11th webcast and, according to my notes, he did say that if the low in Feb 2010 ($1,045) was the 17 month cycle low then gold could go as high as $1,590 by early 2011 with normal corrections back to $1,155 +/- $26. However, Merriman's thoughts in my first paragraph contradict his thoughts in this paragraph unless, of course, gold does close this week above $1,175.
Ken
#7
tradermama
-
- Traders-Talk User
- 909 posts
Member
Posted 28 July 2010 - 09:38 AM
Hi tradermama,
In Merriman's most recent MMA Gold & Silver Weekly Comments and Trade Recommendations (July 26) he specifically stated that a weekly close below $1,175 would suggest that gold has topped out and it may be down from here into mid-December with a price target range of $975 to $1,060. He told his subscribers to buy if gold falls between $1,173 to $1,181 with a stop-loss at $1,167. Well, those stop losses of $1,167 would have been hit yesterday so I don't know what Merriman is thinking in the short term.
By the way, I also watched Merriman's July 11th webcast and, according to my notes, he did say that if the low in Feb 2010 ($1,045) was the 17 month cycle low then gold could go as high as $1,590 by early 2011 with normal corrections back to $1,155 +/- $26. However, Merriman's thoughts in my first paragraph contradict his thoughts in this paragraph unless, of course, gold does close this week above $1,175.
Ken
Yes, Ken. I have that too for early 2011...using gld because gold doesn't show money flow index on stockcharts...if you use MFI (8) indicator and put a 34 ema on the indicator ( sorry I still can't figure out how to post charts..too time consuming and I'm impatient)...it's under the 20 showing very oversold and typically is a good gauge for a buy/bounce to come soon. Another indicator I use which I got from Tom McCellan is taking the RSI (14) and putting a 39EMA on the indicator..this will show you if the trend is weak or strong...it's been going down but also is at a Feb low. The RSI would need to get over that 39ema for the trend to come back and then make a higher high on the RSI from the last one which was June to show a strong trend.
So the question would be, if the bounce that is to come is the cycle low which John's work shows in 4 week or just an oversold bounce. I dont like forecasting. I just like to know my bearish/bullish marks to watch. I'll let others smarter than me forecast.
which I do appreciate all inputs.TM
#8
SilentOne
-
- Traders-Talk User
- 3,452 posts
Member
Posted 28 July 2010 - 09:46 AM
Ken,
If you've followed Merriman's comments and forecast the past few months, he had a fairly bullish view on many assets for this summer and expected more upside for many markets. This was based on the astrology side of his work.
That did not pan out and I think a bearish view has developed that could lead to difficult markets into this fall. This is being suggested by the cycles I follow and he has made the same comments. As I mentioned above, when 1168 gold fell yesterday, it points to a bearish cycle unfolding here. When a primary low (May 17th) fails, it leads to a weak or bearish cycle. Merriman often repeats this concept in his cycle musings.
cheers,
john
"By the Law of Periodical Repetition, everything which has happened once must happen again and again and again-and not capriciously, but at regular periods, and each thing in its own period, not another's, and each obeying its own law ..." - Mark Twain
#9
stubaby
-

- Traders-Talk User
- 1,661 posts
Member
Posted 28 July 2010 - 10:02 AM
Tradermama/Ken/SilentOne:
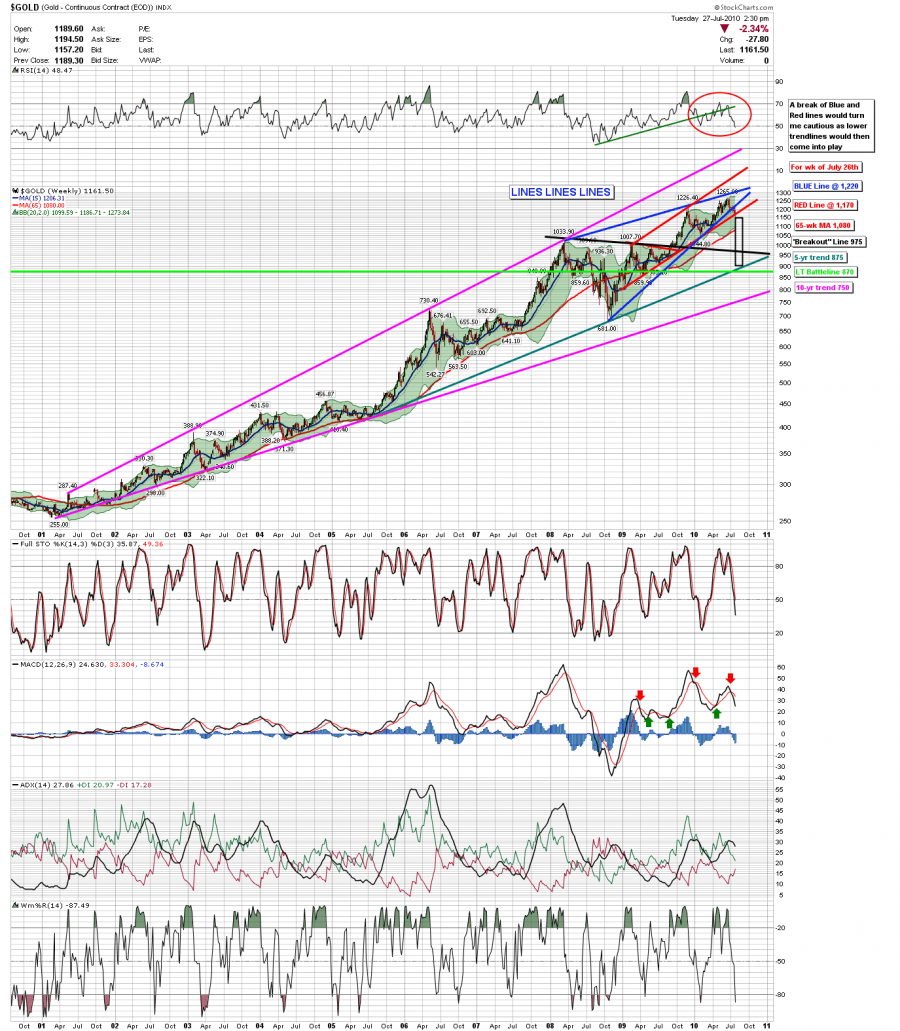
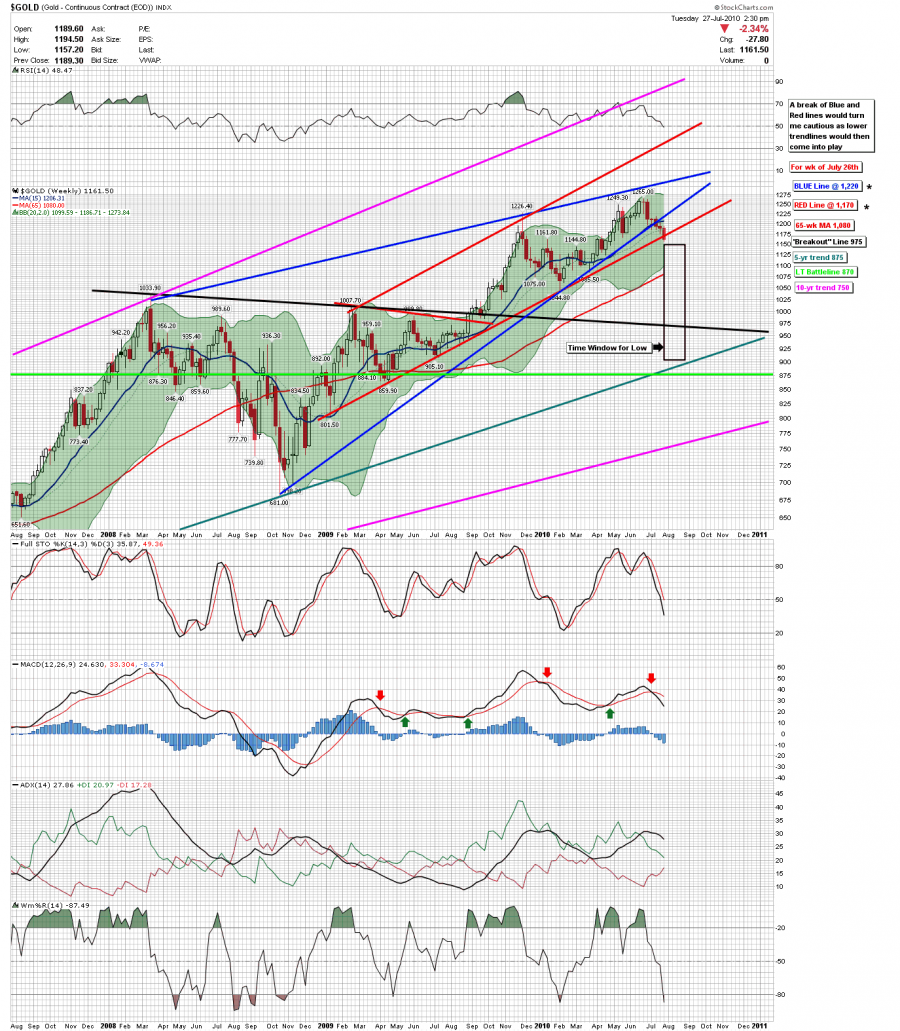
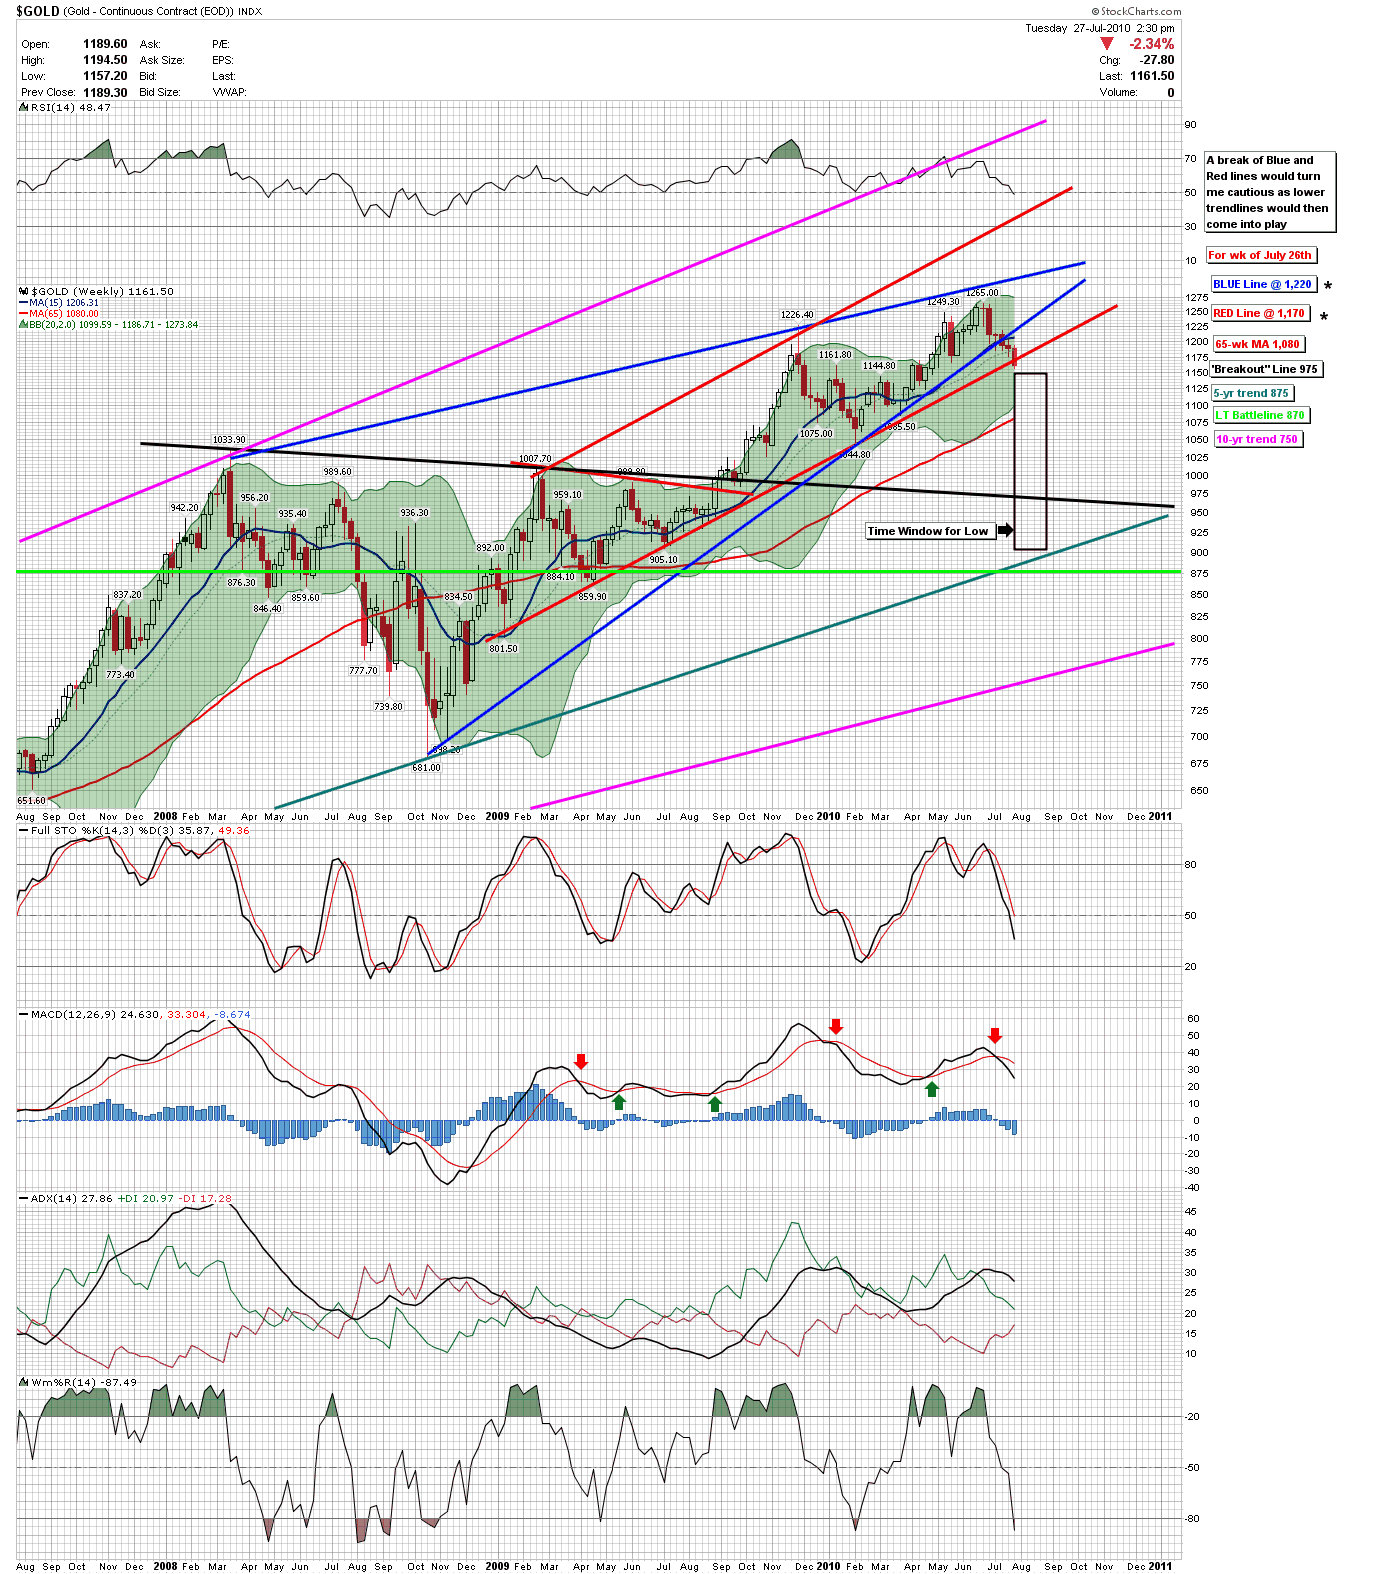
Thanks for all your input and thoughts - some support zones and "time window" targets from the weekly charts:
 stubaby

 stubaby
#10
dharma
-

- Traders-Talk User
- 9,625 posts
Member
Posted 28 July 2010 - 12:06 PM
interesting. its why i do my own work
there are quite a few possibilities out there.
the gold market is showing bottoming action
as long as the divergences hold
i will let the market tell me
there is only one rhythm that is held true to form for this entire bull
the others are reliable to an extant.
i agree w/sinclair, and have thought for some time , the banksters would get long
so, we see how hard they lean or if their buying is done. on the 1st 25 drop they started
buying. armstrong is claiming goldman is using his work.
dharma
all i know is the way to play a bull is to have a seat on his back


