SmallCap
S&P 500
REIT Timing
Gold Timing
Nasdaq 100
International + 40.3 %
+ 28.3 %
+ 44.9 %
+ 23.5 %
+ 20.0 %
+ 13.5 %
FibTimer currently has 12 successful strategies
S&P 500 Position - BULLISH
Nasdaq 100 Position - BULLISH
Gold Stocks Position - BEARISH
SmallCaps Position - BULLISH
U.S. Dollar Position - BEARISH
These positions were started over previous weeks. You need a paid subscription for real time signals. Sector Funds, ETF and Stock positions are not included above.
S&P 500 Index (SPX) Chart Analysis
Last week we wrote:
"Of the many Wall Street proverbs, "The stock market climbs a wall of worry." is often used to explain why a rally is occurring when many feel it should not be. Subscribers know that we follow trends and feelings are not part of the equation. But we do find it interesting when we see these "feelings" affecting the markets."
This week:
After early week losses, the stock market reversed and rallied on Thursday and Friday. As we discussed two weeks ago, selloffs that are in response to news events typically have only a short term effect on the markets.
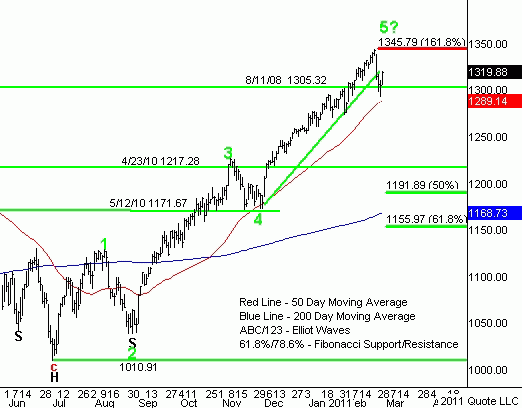
This week's selling; because of the turmoil in Libya, the potential for disruption to the oil fields and global supply, and also the possibility that this might spread to other mid-East countries, especially Saudi Arabia, resulted in two days of heavy losses. But the losses ended at the 50-day moving average line for the S&P 500 Index - SPX and Friday's close was above the SPX 1305.32 support line (see daily chart below).
It is hard to call next week. The disruptions could worsen or end. But again, news events typically do not result in a change in trend and declines are usually short lived.
The selling also resulted in a rise in market pessimism. To a contrarian this is bullish. The stock market often climbs a wall-of-worry so "worries" convince enough investors to hold back and eventually those investors will have to return to the markets, driving them higher.
This was a holiday shortened trading week. The losses generated on Tuesday and Wednesday were about half erased by the week ending rally. The daily chart (below) shows that the important support levels held.
Last week we wrote: "Such a substantial rise cannot be sustained without profit-taking along the way. The SPX is hugely overbought and over due for a correction. Remember that profit-taking is normal and healthy for a bull market. The longer it is delayed; the steeper is the selling when it finally occurs."
Was this week the correction?
Typically corrections result in a 3 wave decline. If this correction follows the same pattern, we have a wave A completed, wave B is possibly in place and a wave C to lower lows still ahead. Importantly, there does not have to be a three wave pattern in a decline, but they do occur more often than not.
We continue to watch the larger five wave pattern (encompassing August to February) in the daily chart below. Five wave patterns are typically followed by substantial declines. The current correction would not be nearly enough to fulfill this forecast.
Of course we still have time for that decline to materialize. We still have the "5?" drawn on the chart and we are still looking for sellers to at least take the SPX into a normal correction in the range of 5-10% near-term. This week's decline was only in the 3.5% range.
This "normal" correction could have started here or we could rally from here and have a correction from higher levels in the future.
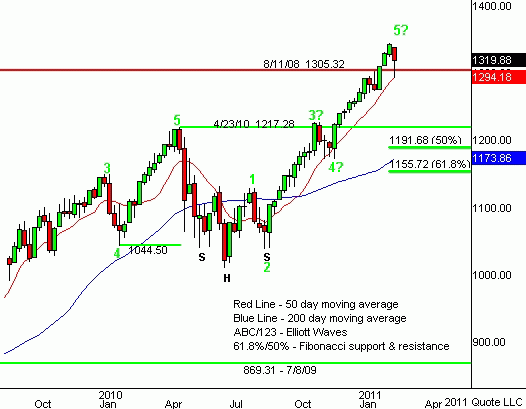
Also, as you can see in both the daily and weekly charts below, the SPX is now above an important resistance level. The 1305.32 level is the rally high from back on August 11, 2008. This week's selling did not manage, for a single day, to close below support.
Conclusion:
The SPX is above its 50-day moving average and its 200-day average which is bullish. The 50-day average is now above the 200-day average which is technically bullish.
There is a bullish head-and-shoulders pattern on the daily and weekly charts. This is a strong indication that we have a long term bottom now in place. This pattern is marked in both below charts with (SHS). This technical indicator's forecast has already been fullfilled.
The target for this advance has been reached at SPX 1305.32, the August 11, 2008 rally high. The new target is at SPX 1345.79.
How the first week of January goes often predicts the direction of the stock market for the rest of the year many say. The first week is now history and it was a bullish one. Also the entire month of January was positive and this is another long term bullish indicator for the markets.
Another indicator is the third year of the president's term in office. Typically the third year is very bullish and of course the third year is just ahead.
The SPX portion of this strategy is BULLISH and in the Rydex Nova S&P 500 Fund - RYNVX (or other bullish S&P index fund). The SPDR Trust - SPY can also be used.
S&P 500 Index (SPX) Daily Chart

S&P 500 Index (SPX), Weekly Chart

Nasdaq 100 Index (NDX) Chart Analysis
Last week we wrote:
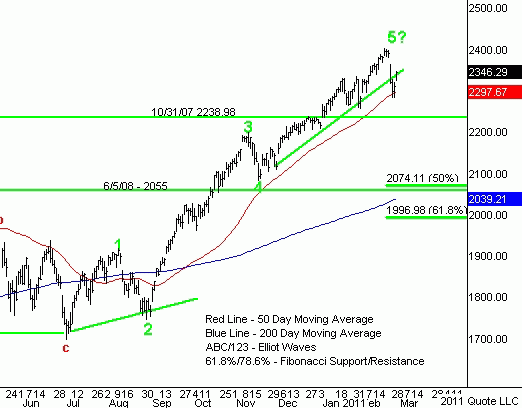
"The Nasdaq 100 Index - NDX rode the wave of buying to new highs this week, closing at 2392.47. We have added a rising trend support line (green) to the daily chart below. This line puts initial support at about NDX 2330. The quickly rising 50-day moving average is just below at NDX 2288."
This week:
The Nasdaq 100 Index - NDX sold off this week but then had a substantial rally to end the week, erasing a bit more than 50% of the initial losses.
The NDX declined right to its 50-day moving average line, and closed the week above the rising trend support line we have in the below chart.
All-in-all this was a bullish end for the week, but the potential for additional selling remains. A normal correction, which we are overdue for, is in the range of 5-10%. This correction was only about 4.5% at its worst including intra-day losses.
Could there be another wave down before the correction ends? This is certainly a possibility although trying to forecast a correction that has been based on a news event is difficult if not impossible. Next week good news could lift the markets to new highs and bad news could result in that third wave down.
The next real resistance is the 50% retracement for the entire 2000-2002 bear market decline. That is all the way up at NDX 2730.05. It was originally reached back on January 23, 2001. We will have a normal correction somewhere in here, and likely it will be sooner rather than later.
The NDX "remains" overbought and overdue for a normal correction. Normal is in the range of 5% to 10%.
Support is now at NDX 2340, the rising trend support line. The 50-day moving average is at NDX 2297 and is also a strong support level, resulting in a reversal this week.
Conclusion:
The NDX is above its 50-day moving average. The NDX is above its 200-day moving average. The averages have crossed and are confirming the advance.
We have little resistance ahead but somewhere in here we will see a substantial correction. It could have begun this week but that remains to be seen. There is no level to watch for except the 50% retracement level of the entire bear market decline. This is up at NDX 2730.05 and we will certainly correct before reaching it.
The NDX portion of this strategy is BULLISH and in the Rydex NDX 100 Fund - RYOCX (or other bullish NDX 100 index fund). The Powershares QQQ Trust (QQQQ) can also be used
Nasdaq 100 Index (NDX), Daily Chart

opyright 1996-2011 Market Timing Strategies, Inc., All Rights Reserved.
This ProTimer report may be distributed as long as it is used in its entirety.
This report is send only to those who have requested it. If you receive this report in error, please follow the below instructions for immediate removal of your email address.
Disclaimer: The financial markets are risky. Investing is risky. Past performance does not guarantee future performance. The foregoing report has been prepared solely for informational purposes and is not a solicitation, or an offer to buy or sell any security. Opinions are based on historical research and data believed reliable, but there is no guarantee that future results will be profitable.


