(This is an excerpt from Friday's blog for Decision Point subscribers.)
The U.S. Dollar Index is in immediate danger again, so lets take a close look at charts from all three time frames, beginning with the daily bar chart. The most important feature on the chart is the bold rising trend line near the bottom. That is a long-term rising trend line that we will see on the longer-term charts. Note that in November the Index bounced off that line only to retest and penetrate it just a month later. The November breakdown was a bear trap, resulting in a strong rally, which ultimately failed.
The decline from the January top has resulted in a test and retest nearly identical to the previous one, and we are left to wonder if this latest breakdown will be another bear trap.
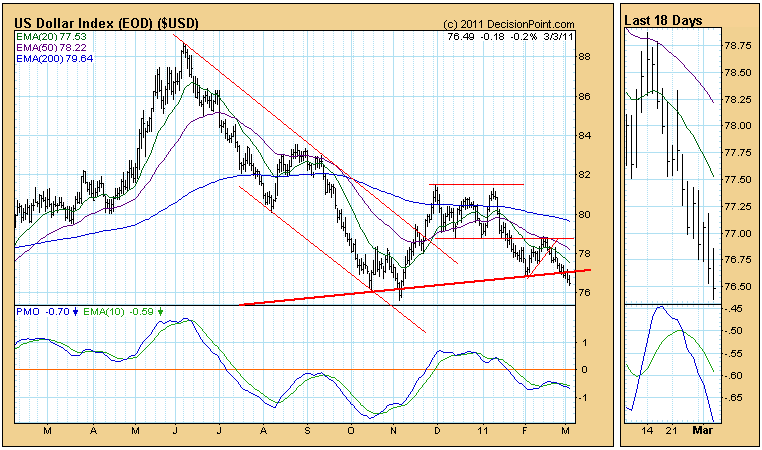
I am assuming that this is more serious than the first. As of 1/20/2011 the US Dollar Index is on a Trend Model SELL signal. And the PMO configuration is less promising than the oversold PMO bottom in October followed by a PMO positive divergence in November.
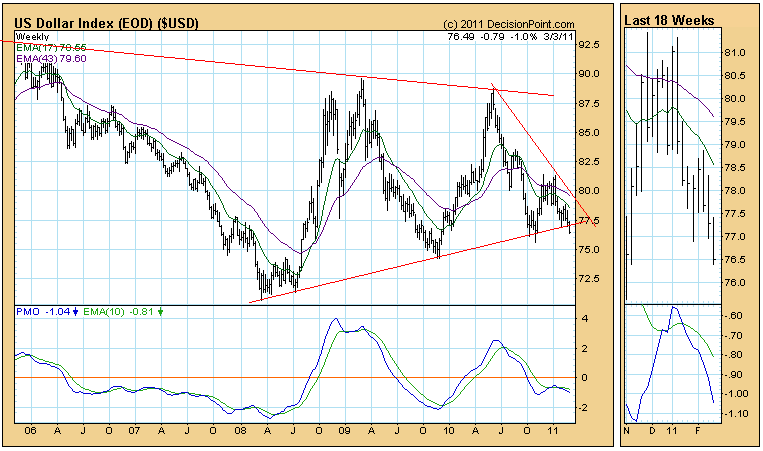
The weekly chart below shows the entire rising trend line and demonstrates that it is important support. The weekly PMO is negative and falling.
Finally, the broader context of the monthly chart shows that the rising trend line forms the bottom of a reverse pennant formation. A decisive breakdown from that pennant would have serious implications regarding the potential downside.
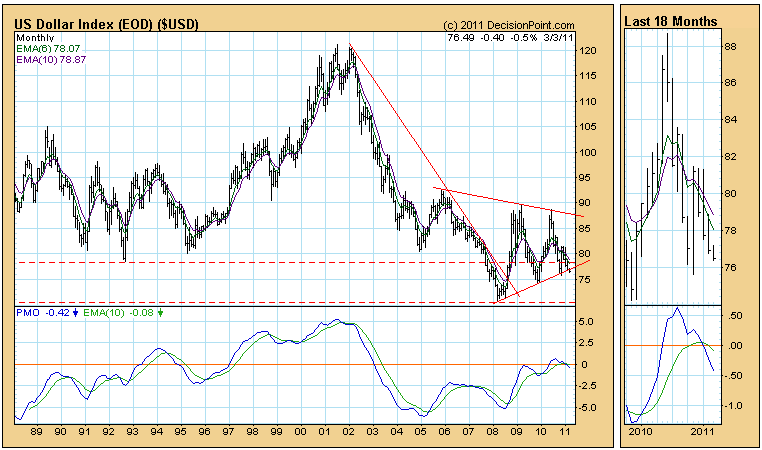
Bottom Line: The Dollar Index has broken down through important long-term rising trend line support. A similar breakdown in November proved to be a of no consequence, but technical indicators are less favorable this time around, so we should expect the decline to continue longer-term, although, a short-term snapback toward the line would be a normal technical reaction.
* * * * * * * * * * * * * * * * * * * * *
Technical analysis is a windsock, not a crystal ball.
* * * * * * * * * * * * * * * * * * * * *
Decision Point's Timer Digest Rankings

BIO: Carl Swenlin is a self-taught technical analyst, who has been involved in market analysis since 1981. A pioneer in the creation of online technical resources, he is president and founder of DecisionPoint.com, a premier technical analysis website specializing in stock market indicators, charting, and focused research reports. Mr. Swenlin is a Member of the Market Technicians Association.

 I am assuming that this is more serious than the first. As of 1/20/2011 the US Dollar Index is on a Trend Model SELL signal. And the PMO configuration is less promising than the oversold PMO bottom in October followed by a PMO positive divergence in November.
The weekly chart below shows the entire rising trend line and demonstrates that it is important support. The weekly PMO is negative and falling.
I am assuming that this is more serious than the first. As of 1/20/2011 the US Dollar Index is on a Trend Model SELL signal. And the PMO configuration is less promising than the oversold PMO bottom in October followed by a PMO positive divergence in November.
The weekly chart below shows the entire rising trend line and demonstrates that it is important support. The weekly PMO is negative and falling.
 Finally, the broader context of the monthly chart shows that the rising trend line forms the bottom of a reverse pennant formation. A decisive breakdown from that pennant would have serious implications regarding the potential downside.
 Bottom Line: The Dollar Index has broken down through important long-term rising trend line support. A similar breakdown in November proved to be a of no consequence, but technical indicators are less favorable this time around, so we should expect the decline to continue longer-term, although, a short-term snapback toward the line would be a normal technical reaction.
* * * * * * * * * * * * * * * * * * * * *
Technical analysis is a windsock, not a crystal ball.
* * * * * * * * * * * * * * * * * * * * *
Decision Point's Timer Digest Rankings
Bottom Line: The Dollar Index has broken down through important long-term rising trend line support. A similar breakdown in November proved to be a of no consequence, but technical indicators are less favorable this time around, so we should expect the decline to continue longer-term, although, a short-term snapback toward the line would be a normal technical reaction.
* * * * * * * * * * * * * * * * * * * * *
Technical analysis is a windsock, not a crystal ball.
* * * * * * * * * * * * * * * * * * * * *
Decision Point's Timer Digest Rankings
 BIO: Carl Swenlin is a self-taught technical analyst, who has been involved in market analysis since 1981. A pioneer in the creation of online technical resources, he is president and founder of DecisionPoint.com, a premier technical analysis website specializing in stock market indicators, charting, and focused research reports. Mr. Swenlin is a Member of the Market Technicians Association.


