

Tim Ord, Editor 16928 Van Dorn Street Walton, Nebraska 68461
www.ord-oracle.com (402) 486-0362. tim@ord-oracle.com
For 30 to 90 days horizons SPX: Flat
Monitoring purposes GOLD: Gold ETF GLD long at 173.59 on 9/21/11
Long Term Trend monitor purposes: Flat
We have "800" phone update that cost $2.00 a min. and billed to a credit card. Call (1-970-224-4441) for sign up. We update Eastern time at 9:45 and 3:15. Question? Call (402) 486-0362.
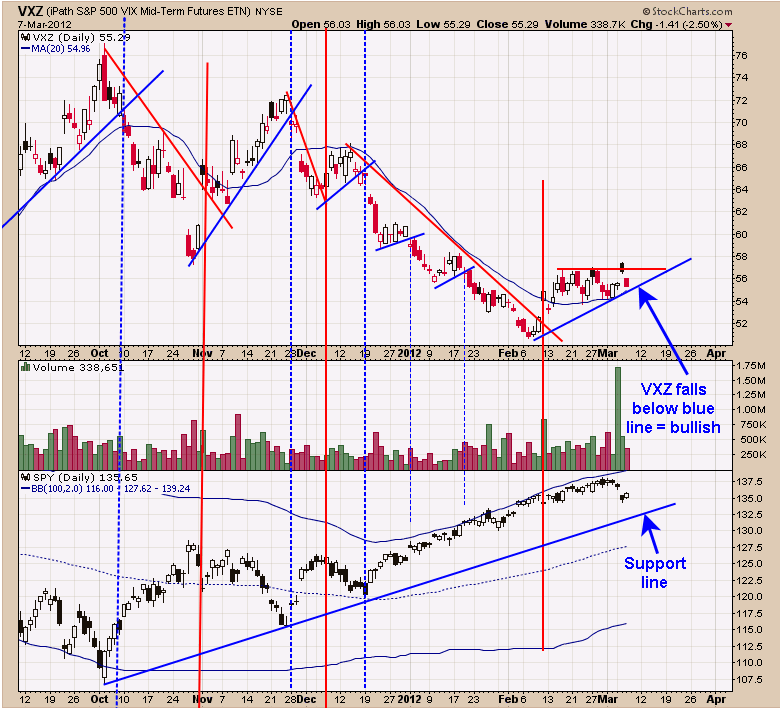
The more indicators that you get to line up for a signal the more confidence youll get in the signal. Above is the VXZ. In general the VXZ moves opposite of the SPY. We have identified bullish signals for the market when VXZ falls below the blue line (dotted vertical blue line is signal day) and bearish signals when the VXZ closes above the red trend line (red vertical lines is signal day). VXZ had a bearish crossover in mid February (vertical red line is the signal day) and the market still pushed higher. Since then the VXZ has moved sideways and has stayed above it 20 day moving average (keeps the bearish signal alive). When VXZ closes below the blue line and its 20 day moving average will trigger a bullish signal. Staying flat for now.
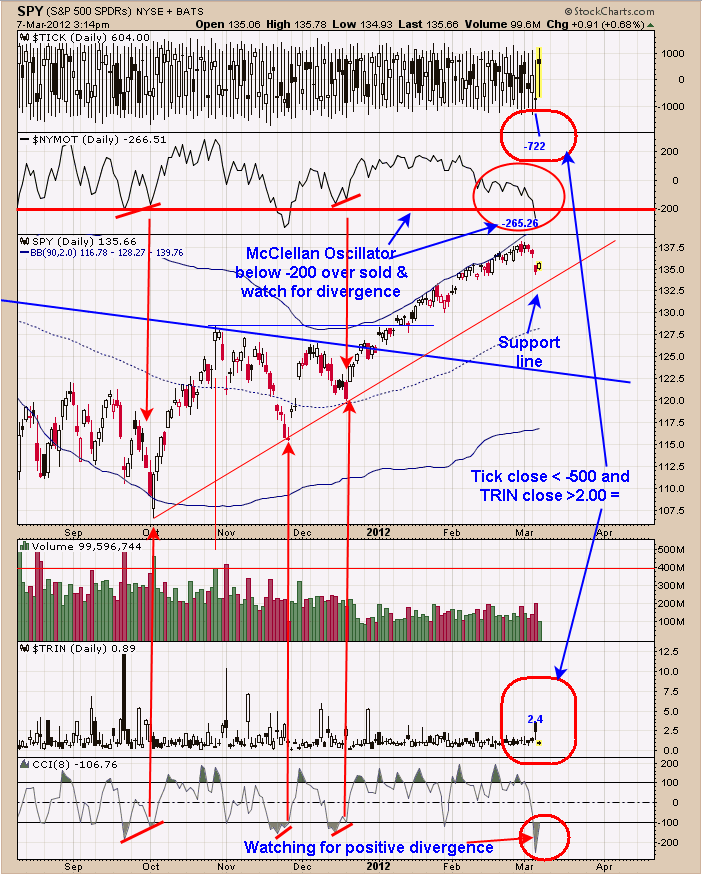
Market is showing bullish signs for short term. The McClellan Oscillator closed yesterday at -265, readings below -200 are oversold. Ideally we would like to see a positive divergence where the SPY makes a lower low and the McClellan Oscillator makes a higher low. Another positive sign would be for the CCI (8) produce a positive divergence also if the SPY makes a lower low than yesterday. We have drawn a trend line up from the October low and it comes in near 133 range on the SPY and it appears that area will hold as support. Yesterday the TRIN closed at 2.40 and the TICK closed at minus 722. We have found that when the TRIN closes above 2.00 and the TICK closes less then minus 500 the same day the market is near a low. A bullish signal may develop near 133 on the SPY. For now we will remain neutral.
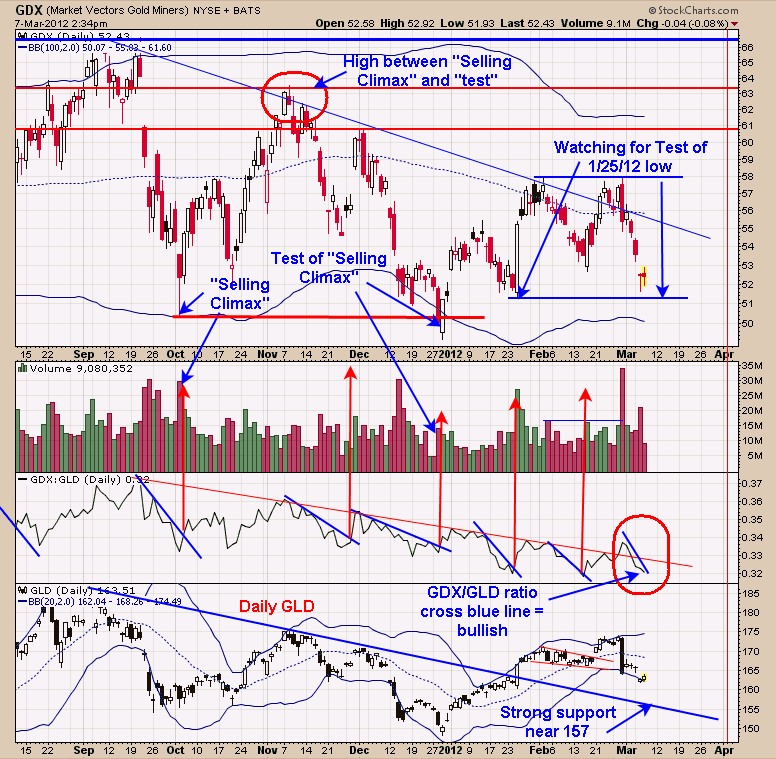
A Selling Climax occurred on GDX on October 4, 2011 and the test came on 12/29/11. The high between these two dates is the minimum upside target, which is the November 8, 2011 at 63.51. What may be forming here is a possible double bottom and test the January 25 low. If the January 25 low is touched on lighter volume and closes above, a bullish sign would develop. We also watch the GDX/GLD ratio and a close above the blue downtrend line would add to the bullish short term picture. The minimum up-side target to 63.51 is still the objective, we dont know at the moment how we will get there but we should get there.
Long GDX 58.65 on 12/6/11. Long SLV at 29.48 on 10/20/11. Long GDXJ at 36.24 on 9/21/11. Long GLD at 173.59 on 9/21/11. Long BRD at 1.67 on 8/3/11. Long YNGFF .44 on 7/6/11. Long EGI at 2.16, on 6/30/11. Long GLD at 147.14 on 6/29/11; stop 170 hit = gain 15.5% . Long KBX at 1.13 on 11/9/10. Long LODE at 2.85 on 1/21/11. Long UEXCF at 2.07 on 1/5/11. We will hold as our core position in AUQ, CDE and KGC because in the longer term view these issues will head much higher. Holding CDE (average long at 27.7. Long cryxf at 1.82 on 2/5/08. KGC long at 6.07. Long AUQ average of 8.25. For examples in how "Ord-Volume" works, visit www.ord-oracle.com. New Book release "The Secret Science of Price and Volume" by Timothy Ord, buy on www.Amazon.com


