
Gold - Long Term View
Started by
Russ
, Jun 24 2013 05:07 PM
19 replies to this topic
#1

Russ
-
- Traders-Talk User
- 7,203 posts
Member
Posted 24 June 2013 - 05:07 PM
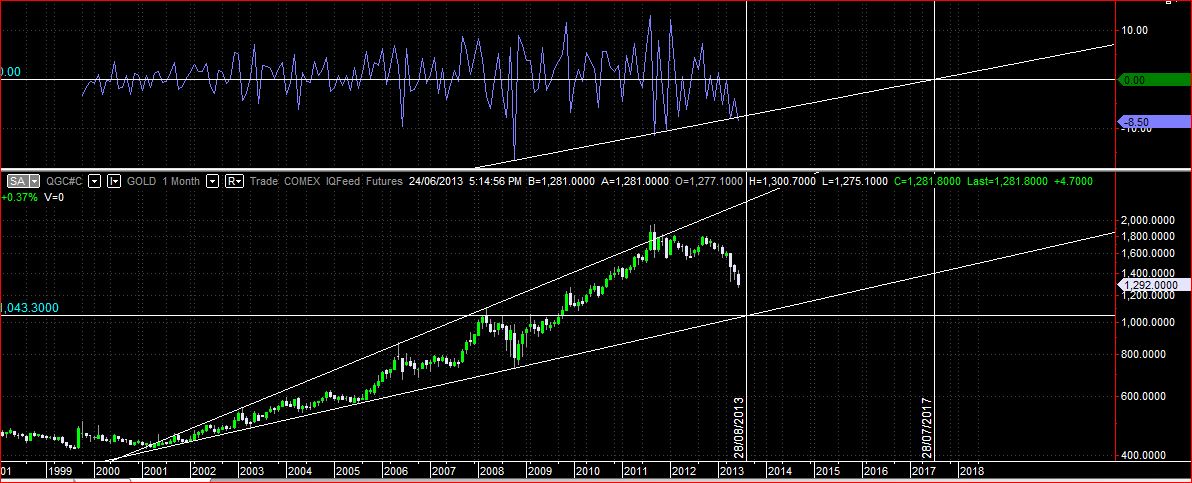
The chart shows a nice wedge formation since 2001, the lower part of the wedge around $1000 should be the low, which I am now getting indications will be either this summer or perhaps October as the GDX chart is suggesting. The high in 2016 or 17 should be around 4500 but it could go higher as it appears we are going to live through a major collapse in government world-wide.
"Nulla tenaci invia est via" - Latin for "For the tenacious, no road is impossible".
"In order to master the markets, you must first master yourself" ... JP Morgan
"Most people lose money because they cannot admit they are wrong"... Martin Armstrong
http://marketvisions.blogspot.com/
"In order to master the markets, you must first master yourself" ... JP Morgan
"Most people lose money because they cannot admit they are wrong"... Martin Armstrong
http://marketvisions.blogspot.com/
#2
Russ
-
- Traders-Talk User
- 7,203 posts
Member
Posted 24 June 2013 - 11:42 PM
After reviewing the charts again, I think 2016 Oct/Nov will be the high, that's what it looks like at this time anyways.
"Nulla tenaci invia est via" - Latin for "For the tenacious, no road is impossible".
"In order to master the markets, you must first master yourself" ... JP Morgan
"Most people lose money because they cannot admit they are wrong"... Martin Armstrong
http://marketvisions.blogspot.com/
"In order to master the markets, you must first master yourself" ... JP Morgan
"Most people lose money because they cannot admit they are wrong"... Martin Armstrong
http://marketvisions.blogspot.com/
#3
johngeorge
-

- TT Member+
- 4,616 posts
Member
Posted 25 June 2013 - 10:07 AM
Thanks Russ
I am always appreciative of your thoughts and analysis.
Best to you 
Peace
johngeorge
johngeorge
#4
Russ
-
- Traders-Talk User
- 7,203 posts
Member
Posted 25 June 2013 - 10:27 AM
Your welcome JohnGeorge, I have appreciated your posts too.
The Gold high for 2016 has been on my blog since last winter, this is a long term signal which appears to be carved in stone as was the major low in 1999 which the oscillator actually predicted as far back as 1993, or the housing index low in spring 2009 which I predicted on the FF in early 2007. The SP500 is peaking in this time frame, perhaps as late as early July or it may have already peaked, this is going to be a serious decline which others are noting too such as Semibizz on the mainboard and Dan Murphy...
http://milliondollar...43afd93bb48b740
Russ
Thanks Russ
I am always appreciative of your thoughts and analysis.
Best to you
"Nulla tenaci invia est via" - Latin for "For the tenacious, no road is impossible".
"In order to master the markets, you must first master yourself" ... JP Morgan
"Most people lose money because they cannot admit they are wrong"... Martin Armstrong
http://marketvisions.blogspot.com/
"In order to master the markets, you must first master yourself" ... JP Morgan
"Most people lose money because they cannot admit they are wrong"... Martin Armstrong
http://marketvisions.blogspot.com/
#5
dharma
-

- Traders-Talk User
- 9,625 posts
Member
Posted 25 June 2013 - 11:00 AM
agree w/you russ on the time period for the high. these next 3 years are going to be action packed!
dharma
#6
fib_1618
-

- Traders-Talk User
- 10,145 posts
Member
Posted 25 June 2013 - 12:05 PM
Just to throw it out there, but the .618 retracement level of $1156 also intersects the longer term rising bottoms line from the 2005 lows.
We're still looking for an August bottom as well.
Fib
https://stockcharts.com/c-sc/sc?s=$GOLD&p=D&st=2004-01-05&en=(today)&i=t21297301910&a=307101247&r=1372179546275.gif
We're still looking for an August bottom as well.
Fib
https://stockcharts.com/c-sc/sc?s=$GOLD&p=D&st=2004-01-05&en=(today)&i=t21297301910&a=307101247&r=1372179546275.gif
Better to ignore me than abhor me.
“Wise men don't need advice. Fools won't take it” - Benjamin Franklin
"Beware of false knowledge; it is more dangerous than ignorance" - George Bernard Shaw
Demagogue: A leader who makes use of popular prejudices, false claims and promises in order to gain power.
Technical Watch Subscriptions
#7
Russ
-
- Traders-Talk User
- 7,203 posts
Member
Posted 25 June 2013 - 01:13 PM
Well, we will see if the Fibonacci Go-d rules or if the hard trend-line does. The chart above was created using Multicharts which allows for fixed point drawing which stockcharts can't do, that line whether using the 2001 low, or the 2005 low, then the 2008 is showing about 1050 as support in August, but we are splitting trend-lines  Yes, its going to be 'action packed' too Dharma! R.
Yes, its going to be 'action packed' too Dharma! R.'fib_1618' date='Jun 25 2013, 10:05 AM' post='662053']
Just to throw it out there, but the .618 retracement level of $1156 also intersects the longer term rising bottoms line from the 2005 lows.
We're still looking for an August bottom as well.
Fib
Edited by Russ, 25 June 2013 - 01:16 PM.
"Nulla tenaci invia est via" - Latin for "For the tenacious, no road is impossible".
"In order to master the markets, you must first master yourself" ... JP Morgan
"Most people lose money because they cannot admit they are wrong"... Martin Armstrong
http://marketvisions.blogspot.com/
"In order to master the markets, you must first master yourself" ... JP Morgan
"Most people lose money because they cannot admit they are wrong"... Martin Armstrong
http://marketvisions.blogspot.com/
#8
dharma
-
- Traders-Talk User
- 9,625 posts
Member
Posted 25 June 2013 - 01:32 PM
fwiw i am looking for a july low
dharma
#9
Russ
-
- Traders-Talk User
- 7,203 posts
Member
Posted 25 June 2013 - 01:48 PM
Dharma,
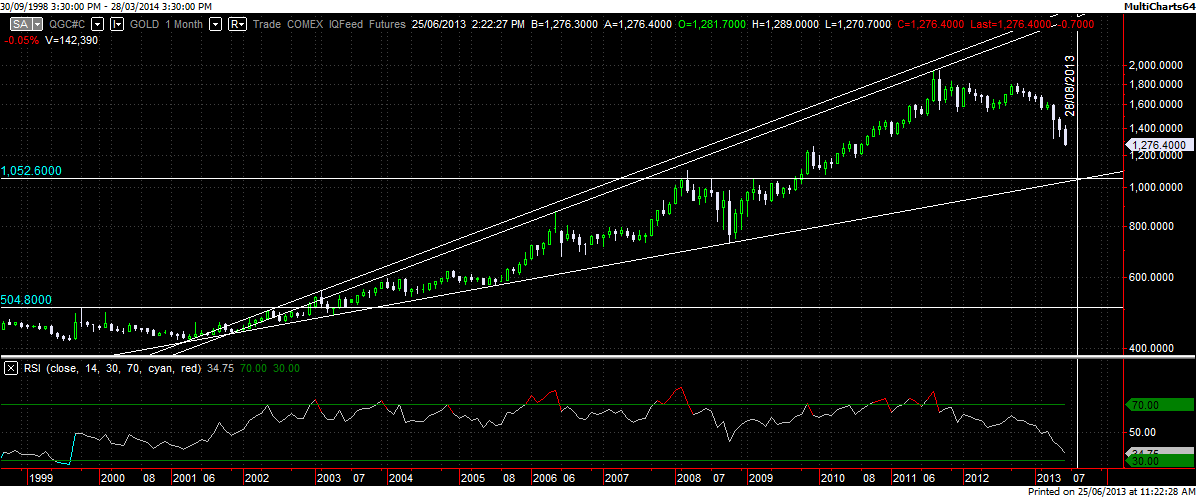
I do have some trend-lines for a low on July 10th-11th which also happens to be very close
to Armstrong's pi cycle applied to the Sovereign Debt Crisis, that date is the 7th I think. The August low was based more on how the lower trend-line was lining up with support around 1050 and I though mid July was too soon to make it down to 1050 but maybe it can, just have to stay nimble.
This is the trend-line support chart drawn as carefully as I can, note the rsi approaching the 1999 level...
fwiw i am looking for a july low
dharma
Edited by Russ, 25 June 2013 - 01:49 PM.
"Nulla tenaci invia est via" - Latin for "For the tenacious, no road is impossible".
"In order to master the markets, you must first master yourself" ... JP Morgan
"Most people lose money because they cannot admit they are wrong"... Martin Armstrong
http://marketvisions.blogspot.com/
"In order to master the markets, you must first master yourself" ... JP Morgan
"Most people lose money because they cannot admit they are wrong"... Martin Armstrong
http://marketvisions.blogspot.com/
#10
fluid
-

- Traders-Talk User
- 2,837 posts
Member
Posted 25 June 2013 - 04:44 PM
The chart shows a nice wedge formation since 2001, the lower part of the wedge around $1000 should be the low, which I am now getting indications will be either this summer or perhaps October as the GDX chart is suggesting. The high in 2016 or 17 should be around 4500 but it could go higher as it appears we are going to live through a major collapse in government world-wide.
@011 was a throw over last gasp bull and now we are in a wave 3 of the decline??


