
Our proprietary predictive modeling systems are showing us a core market dynamic that many people are completely unaware of right now. We are going to show you something in this post that is so valuable that you won’t believe we are sharing it with you. Why are we doing this you might ask? Because we want you to think about how different your daily trading routine would be like as a member of Technical Traders Ltd. and how our specialized research and proprietary modeling systems can assist you in staying ahead of the markets.
If you’ve followed any of our previous analysis posts, you already know we called this market bottom as it happened, over 60 days ago. You also know we’ve been predicting the markets to rally in an attempt to breach the all-time market highs for the past 40+ days. Now, you are going to learn what the markets are going to do over the next 3~5+ weeks as a dynamic price valuation shift is starting to unfold. If you want to see what the markets are going to do all the way into early 2019, then join www.TheTechnicalTraders.com and learn how we can help to keep you ahead of these market moves and learn how we can help you find profits every week.
Here we go..
Right now, as we understand it, a number of institutions and professional traders are watching the global markets for any immediate signs this market will rotate lower and potentially crash. Many institutions are betting that the foreign markets and the US market is overextended and may collapse. Yet, our proprietary analysis and price modeling systems are showing a completely different picture for the next 6~9+ months. You are about to learn how and why you want to focus your trading on specific sectors over the next 4~6 months.
Recent price action in the US majors has been a bit lopsided into the tech-heavy NASDAQ. Because of this, the other US majors have now seen the types of price advances that our predictive modeling systems have predicted. The NQ has advanced substantially as we believe a unique capital flight is taking place where foreign capital is rushing into the US markets chasing profits and earnings. The general consensus is that investing in technology firms will provide the best returns. Well, this may not be the case over the next few months and we believe the real opportunity lies in the Blue Chips and S&P sectors.
This NQ Weekly chart shows that the NASDAQ has nearly rallied to above all-time price high levels and has little more than +1% to go before testing/breaching these levels. Granted, the move in the NQ has been impressive and we believe the primary factor in this move is the rush of capital entering into the technology and biotech markets that make up the NQ sectors driving this rally. Our price modeling systems suggest this move is nearly over and the NQ will likely consolidate and rotate over the next 3 months.
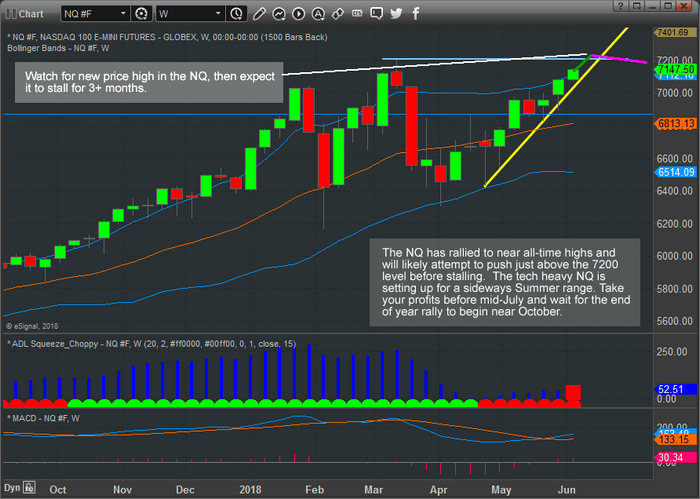
This leads us to believe that capital will shift from the technology and biotech-heavy NASDAQ to the other US sectors that have underperformed recently.
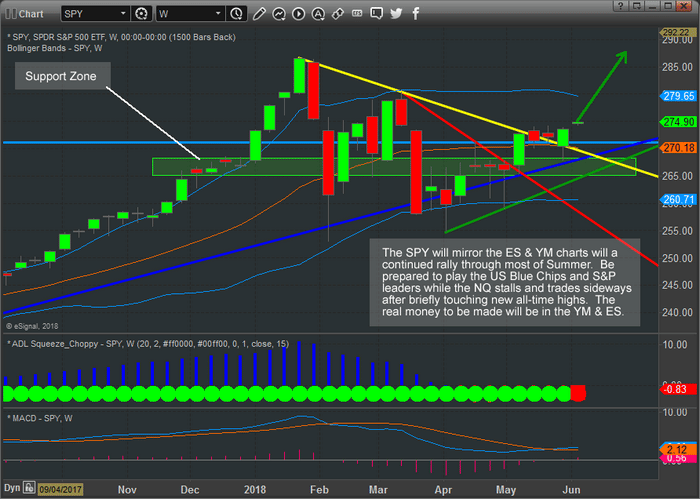
This SPY weekly chart shows what we believe is the underlying shift that is taking place. While the NQ has rallied to near all-time highs, the SPY has just recently begun to advance above recent rotational highs. With a strong support zone near $255 and all-time highs near $268.60, the SPY has a potential for a +4.5% price rally to reach these recent all-time highs.
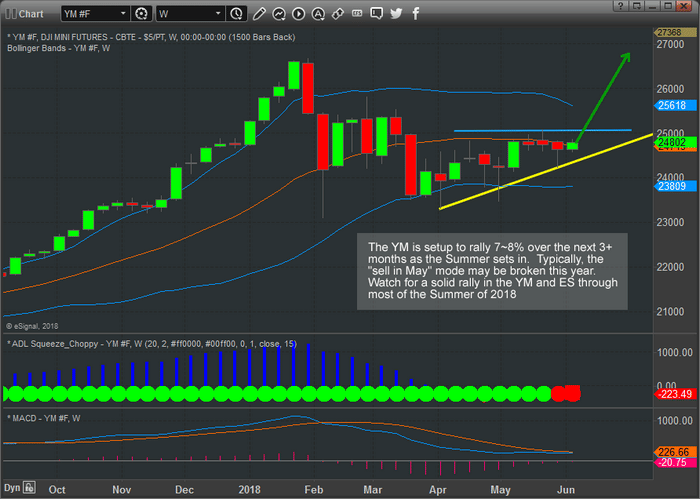
This YM chart shows a similar setup to the SPY. With support near 24,450 and a clear upside sloping price channel, the YM chart shows a potential for a +7~8% upside price move before reaching near all-time highs.
We believe a pricing valuation shift will begin to occur in the US majors over the month of June where the NQ rallies to just above the all-time high levels, stalls and rotates over the Summer months while the S&P and DOW Blue Chips and leaders rally +4~10% over the same time span. We believe this shift in pricing dynamics will be the result of price valuations/expectation levels in the NQ having outrun true earnings potentials. Foreign capital has been pouring into the US technology stocks for well over 16 months now. Much like the 2000 Dot Com bust, this run may be overextended and a pricing shift is likely already started. The real profits over the next few months will be in the S&P and DOW leaders.
Isn’t it about time you made an investment into your trading future that really generated returns for your subscription costs? Take a look at some of our recent research posts to see how accurate our research really is and understand that we are providing you with valuable insight in this article that you will probably start to hear about in 30+ days from all the other researchers. If you want to stay ahead of the markets like we do, then visit www.TheTechncialTraders.com and become a valued subscriber. We know you will be satisfied with our efforts to help you become more successful.


