Intraday Bulls Fight Back
By Ricky Wen, ElliottWaveTrader.net
Monday was a fairly fast-paced trading day. It started with Sunday night weakness at around 2740 in the Emini S&P 500 that continued into the regular trading hours. Essentially, the bears accelerated the downside flush by piercing below last week’s 2735.75 level immediately after the open and dropping into one of our key support areas at 2720.
That proved to be pivotal as that level held as an intraday temporary support in order to make a dead-cat bounce against 2730 in a quick manner. Given that the day's trend appeared to be down with a pattern of lower highs and lower lows, the market eventually sold off into new lows.
Around noon, the market hit a low of 2703.75 which was just a bit above the 2700 major level and forced yet another intraday dead-cat bounce into 2720 where it hit resistance at the trending 15-minute, 20 exponential moving average.
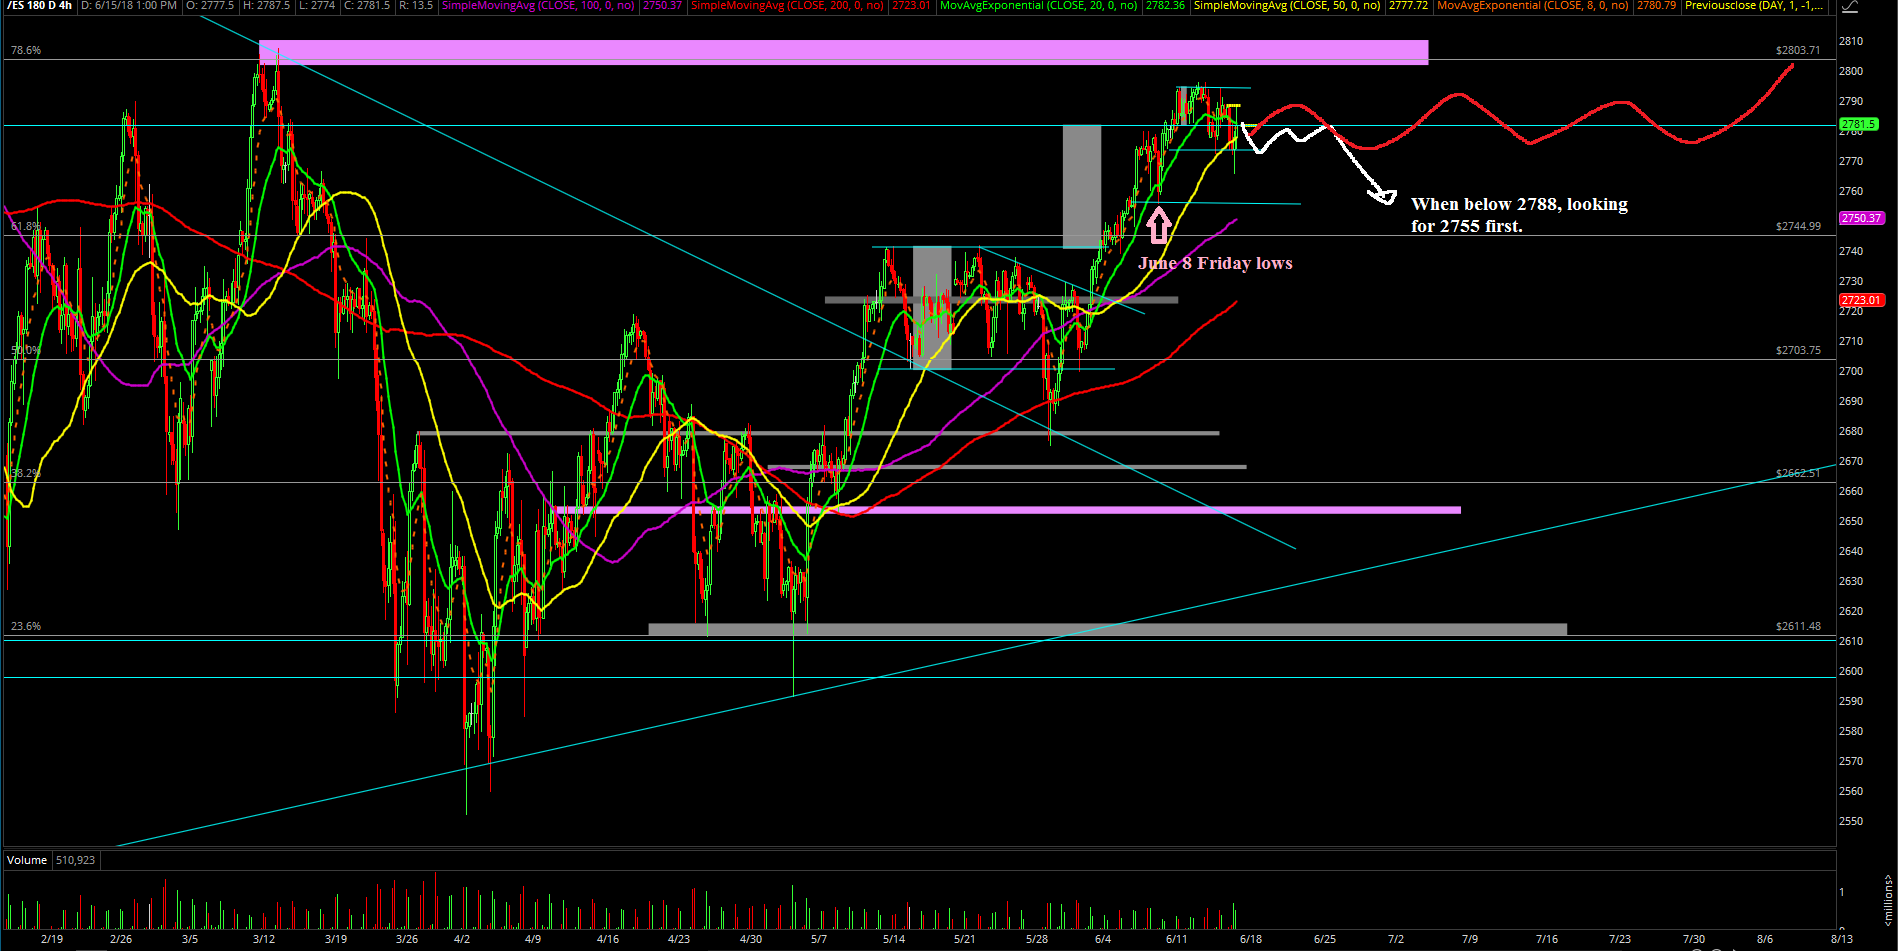
In simplest terms, the main context to understand here is that the market was in an extreme oversold manner as noted by our proprietary signals, so traders had to be cautious of a V-shape bounce possibility to reset the pressure if support held. Also, we had a high probability scenario imposed on our 4-hour white line projection that we drew and the market managed to follow it perfectly for the rest of the day by making a nominal lower low at 2700.5 before closing off with a little stick-save in the 2720's region.
The main takeaway from this session is that the market is now testing a major support level/region at 2700-2720, and it's a key time to form the bottoming phase for the turn. Otherwise, the market needs to back-test even lower-end support level if this 100 point drop isn’t enough already to catch a bid for the bigger picture.
What’s next?
The daily closed at 2722.5 and the market dropped as much as 55 points during the day from Friday’s closing price, but intraday bulls fought back with a little stick-save to close down around 34 points for the day.
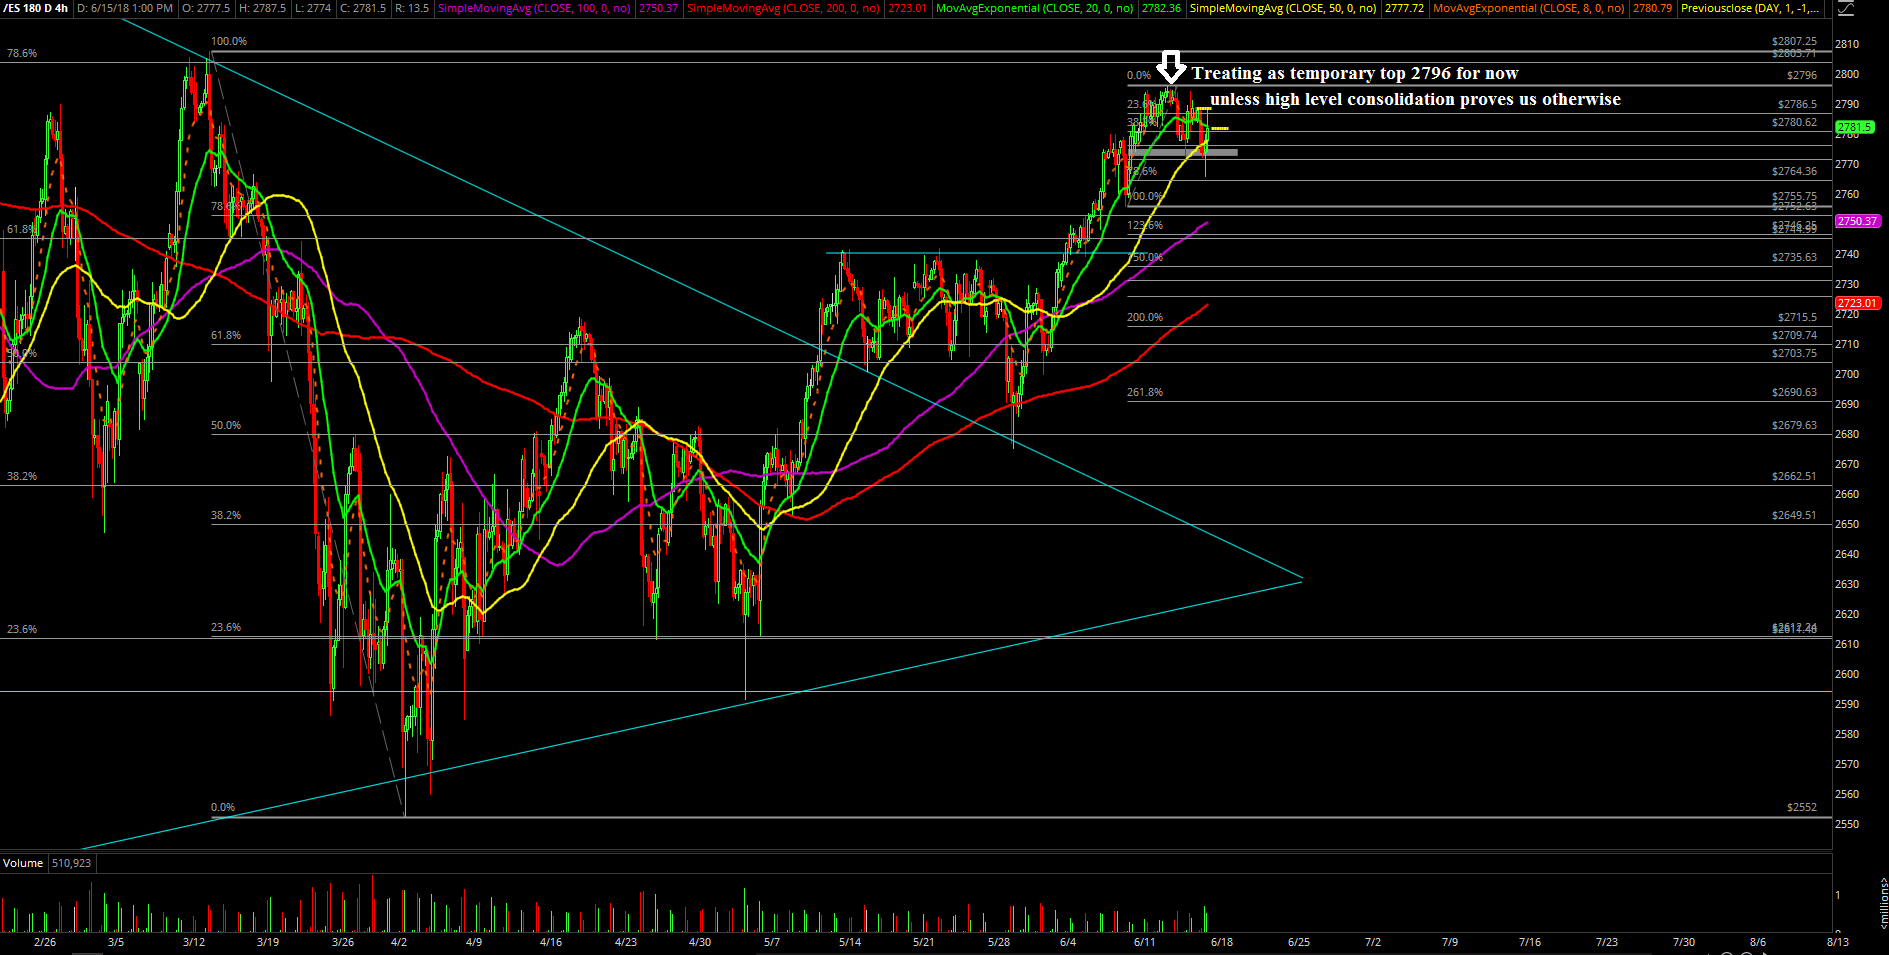
Heading into Tuesday and the rest of the week, we can effectively treat 2700.50 as a temporary double-bottom low for now. Also, we'll be watching closely if market just continues to follow our 4-hour white line projection chart precisely as expected given our thesis favoring the next 75-100 points to the upside.
At this point, there’s not much more we could say because if the market decisively pierces the 2700 level, then there’s nothing left until next support at around 2680-2685. For now, the 4-hour white line projection (see last chart on charts page) remains king until the market invalidates the "perfect" roadmap.