RBOB Gasoline Futures:
https://www.cmegroup...b-gasoline.html
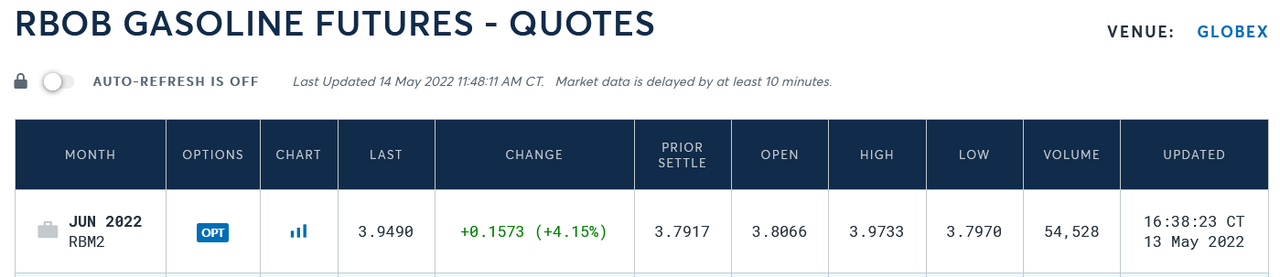
https://www.cmegroup...ine.quotes.html
Live Java enabled chart, updated continuously.
Market data is delayed by at least 10 minutes.
RBOB: Reformulated Blendstock For Oxygenate Blending.
About 30% of the U.S. market requires gasoline to be reformulated.
The price for the RBOB gasoline futures contract is quoted in
U.S. dollars and cents. The minimum price tick for RBOB is 0.0001,
equivalent to a movement of $4.20 for one contract. The contract unit
is for 42,000 gallons or 1,000 barrels.
Check the weekly chart. wOW.
From the main page, hit QUOTE.
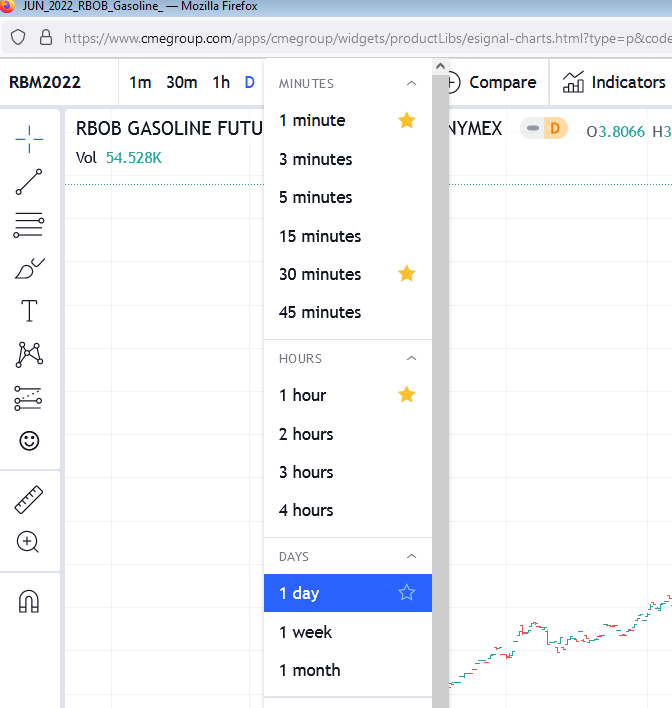
From QUOTE page, select CHART.
On the chart ribbon at top, select Time Interval.
For Daily Chart, select One Day.
For Weekly Chart, select One Week...etc.
For Bars, Sticks or Area charting, select those icons to the right of Time Interval.
![]()