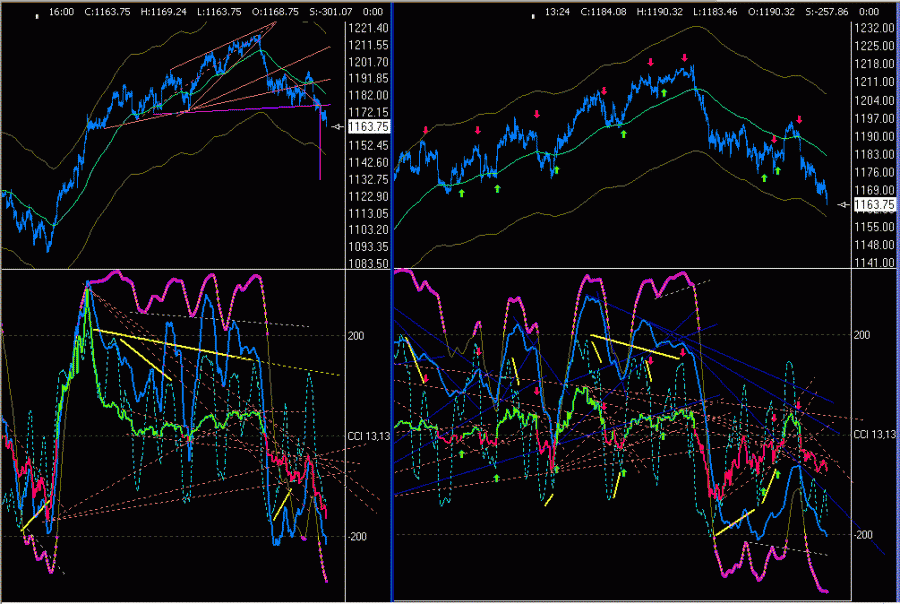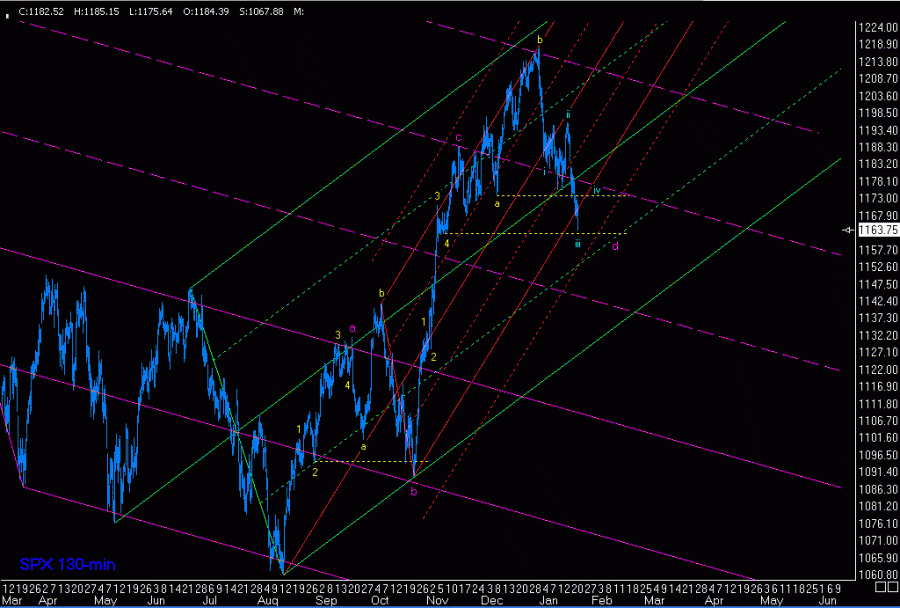
as far as the forks and fractals are concerned, i've needed to come back to a numeric downward count, as it now seems to me that the downward moves are clearly impulsive, but with a fairly sharp and complex corrective wave between. in the 130-min chart, you'll note that the price level ended right on the lower MLH (median line parallel) of the red ML set, which if i were to guess monday's open based on that clue alone, i would guess that we'll see a gap-down open... if that occurs, that pattern would be what Tim Morge calls a Zoom pattern, which is when the price literally zooms right through the ML. at this time, i'd guess that monday or tuesday will be a ST reversal day, and that the remainder of the week will be upward to sideways... twt.

the daily spx shows the possibility that the december high was the top of wave-c, and that this drop was actually a simple zig zag, which could end this coming week. though i don't currently favor this resolution, i did want to at least acknowledge its possibility and give you a heads up.

then the weekly spx brings me back to my original thesis from several weeks ago, that a complex wave-d was in the process of forming, and that because the previous wave-b was rather deep, this wave-d would be a bit more relatively shallow, and as you can see, the price range is now in the range that i favored then also, which was the 1162-74 range.

finally, my longer-term momentum indicator on the weekly spx seems to suggest that we still need a week or two more in the down to sideways mode, so that the dark blue line can drop down a bit more towards the UTL, from which we should see a bounce as we move upward in a final wave-e to finish out this bull market segment that began in 10/02... but as always, twt.

have a great weekend!
--tsharp


