Jump to content


Photo

NEM


  • Please log in to reply
4 replies to this topic

#1 SilentOne

SilentOne

    Member

  • Traders-Talk User
  • 3,452 posts

Posted 01 February 2005 - 06:51 PM

Posted Image

So as usual, everyone's all out bearish and given up on PMs for the next 1-2 years. Yet we are still within the channel. :lol:

The one to watch.

cheers,

john
"By the Law of Periodical Repetition, everything which has happened once must happen again and again and again-and not capriciously, but at regular periods, and each thing in its own period, not another's, and each obeying its own law ..." - Mark Twain

#2 Chart Guru Doug

Chart Guru Doug

    Member

  • Traders-Talk User
  • 2,789 posts

Posted 01 February 2005 - 07:08 PM

might be ven closer then you think.

Attached Thumbnails

  • nem.gif
  • nemz.gif

I am not your registered investment advisor. This is not a recomendation to buy or sell. This is my opinion and that is all. I may be long or short any security and change my position at any given moment in time. Do your own due diligence before investing any of your own financial assets.

#3 SemiBizz

SemiBizz

    Volume Dynamics Specialist

  • Traders-Talk User
  • 23,208 posts

Posted 01 February 2005 - 08:56 PM

Here's what bothers me about NEM... Take a look at the volume spike of 1/15/04 .... 19M shares 43.75 Swing High 41.60 Swing Low. Basically NEM has traded $6 on either side of that candle. We've never had a volume anywhere near 19M share day since 1/15/04. My point is this, these volume spikes tend to attract price like a magnet. I have a hunch based on the recent 10M spikes that this stock wants to go lower. For example: 12/8 10.4m Candle Swing High 44.85, Swing Low 43.00 .... Then on 1/4/05 10.7M shares Swing High 42.69 Swing Low 41.44. Here's the problem, NEM was unable to break the swing high of 12/8, even though it had plenty of volume. Also NEM broke the swing low of 12/8 on MORE volume... I think you'll be looking at this 41.44 - 43.80 area (swing high from 1/3) for some time. It actually is somewhat confirming that 2004 candle. I'd use stops on this one for sure, because if it does get away from you, it's going all the way back to $35.... of course, it can also break higher and try and make the $50. I guess overall, the thing is in the middle, that's not the highest risk/reward area to be long or short... I think you'll see this thing under $40, I would place a stop there. I have traded this stock for about 5 yrs now... good luck if you decide to go long here...
Price and Volume Forensics Specialist

Richard Wyckoff - "Whenever you find hope or fear warping judgment, close out your position"

Volume is the only vote that matters... the ultimate sentiment poll.

http://twitter.com/VolumeDynamics  http://parler.com/Volumedynamics

#4 bobalou

bobalou

    Member

  • Traders-Talk User
  • 1,878 posts

Posted 01 February 2005 - 09:21 PM

I would like to add in ,,the $$ is a if e. to me now...so I covered 2/3's my short on mdg at close for plus $1...senor ,got to me.cash is good. nice john..it seems a lot of do or die..a chaseing we go

#5 SilentOne

SilentOne

    Member

  • Traders-Talk User
  • 3,452 posts

Posted 02 February 2005 - 06:29 AM

Doug, 
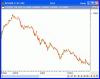
Nice chart there. It is the symmetrical triangle there that says this leg down is about done. A bounce off the trendline, wherever it lies looks imminent then. I added a partial position in NEM today. HL as well. It would have to have completed a 3 leg move (ABC) to this point for a decent rally. Greenie day stands as a possible turning point once again. This time I will be watching the bond market more that the USD. If you look back to 2003, the USD bounced quite strongly yet the PMs began their biggest run in that environment. I wonder if the same thing can happen this year sometime. One other thing. If the HUI starts another leg up this year from these levels to test the highs, it would be incredibly bullish. Why? The EW concept of alternating patterns would suggest that we have merely seem the HUI subdivide (1,2s) so far. Until gold breaks below the 65 week MA, the bull is intact. I will still trade it more than anything right now, looking for the next leg up. cheers, john
"By the Law of Periodical Repetition, everything which has happened once must happen again and again and again-and not capriciously, but at regular periods, and each thing in its own period, not another's, and each obeying its own law ..." - Mark Twain