|
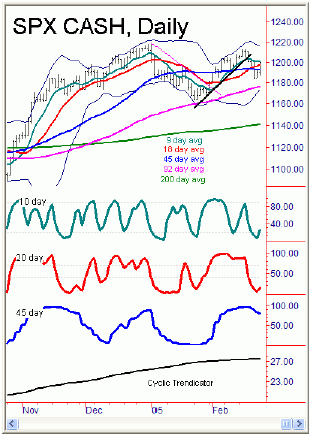
S&P 500 CASH SPX CASH: Daily Projected Support and Resistance levels: High - 1182; Low - 1171JUNE SP: Daily Projected Support and Resistance levels: High - 1184; Low - 1173 SPX CASH: 5-Day Projected Support and Resistance levels: High - 1181; Low - 1155 JUNE SP: 5-Day Projected Support and Resistance levels: High - 1183; Low - 1157 SPX CASH: Monthly Projected Support and Resistance levels: High - 1204; Low - 1138 SPX CASH: Yearly Projected Support and Resistance levels: High - 1292; Low - 1135 Current SPX Index Positions: Mid-term (6-8 weeks) = 25% BEARISH from 1211.27 (covered ½ 1164) From previous outlook: "Friday’s action has not yet taken out the 1163.69 swing low on the SPX, which means that the drop from the 1189 high could simply be a ‘B’ wave in Elliott-wave, one which can still be followed by new swing highs above 1189.80 in the coming days if the 1163 low holds the downside. In fact, if prices are going to continue back to new swing highs above 1189.80 in the coming days, then really Friday’s 1169.91 intraday low should not be solidly violated to the downside. You can see on the channel chart above that, at Friday’s close, we ended the day slightly above the smallest channel, with Friday’s intraday low hitting right at the bottom of this same channel. In other words, the very minor trend is still up above the 1163-1169 region and there is still the possibility for one more new swing up to new highs above 1189.80 and for a try at the 1193-1194 region or higher." | |
| Current analysis: The SPX quickly took out Friday’s intraday low of 1169.91 in today’s session -however that break was not solid with the tag of 1167.72 at the lows and was then followed by an upside reversal into late-day trading.Volume came in at around 1.65 billion shares. As per the notes from last night’s outlook, as long as the 1163.80 swing low holds here the downside action into today’s session may have seen the completion of a ‘b’ wave down - which would be expected to be followed by a re-test of the 1189.80 swing top and the possibility of a test of the 1193-1194 ‘statistical range’ for the SPX with the 20 day cycle. Having said that, I am going to once again add that technical action has been weak, and if the market is going to fall short of expectations then it will do so on rally phases. If the index does manage to hold the 1163 area here for another few days, then we know that the statistics with the 20 day cycle indicate that the next minor peak would look best if seen in the coming days (after April 4th), and would also look best with a try at the 1193-1194 area or higher. I am going to add here that major ‘make or break’ resistance for the short-term will also be right at this 1193-1194 region, which will make it tough to get past in the coming days, if tested. |
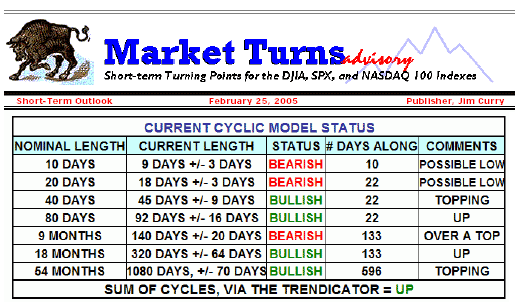
Higher resistance will be solid near the 1204 monthly projected resistance high. On the flip side, taking out the 1163 swing low that tells us that the 20 day cycle likely either witnessed a very bearishly left translated peak - or, alternately, has not yet bottomed, as is it is currently labeled; above 1163 allows for a move back to or above the 1189 level with major shortterm resistance at the 1193-1194 region. The next turning point still looks to be set for April 5-6, which is tomorrow into Wednesday. In other words, if prices manage to slingshot higher back into outlined resistance in the next day or two, then be on the lookout for additional indications of a minor top forming and a run back to the 1163 low or lower in the coming days/weeks. NASDAQ 100 CASH Daily Projected Support and Resistance levels: High, 1490 - Low, 1469 Current NDX Index Positions: From previous outlook: "the assumption right now is that a test of the low 1500’s could still be tested, and that Friday’s selloff to the downside may have actually been a ‘B’ wave decline that will be followed by another swing up to the normal statistical rally range for the 20 day cycle on this index to the 1500-1514 region. This is valid as long as the prior swing low of 1458.26 holds to the downside. If 1458 is broken south then either the 20 day cycle either did not bottom at this area and the down phase of this same cycle is still in progress - or, alternately, the 1495 swing top was a strongly bearish translated peak for a new 20 day cycle." | |
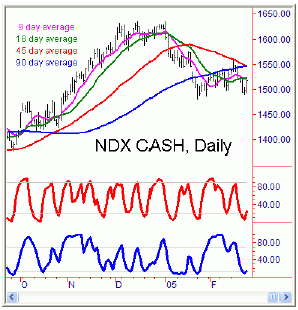
| Current analysis : The NDX also registered lower lows below Friday’s intraday low of 1466.49 on this index, tagging 1461.27 on an early-day low to end the day closer to the high end of the range. Volume here came in at 1.6 billion shares - which is probably mildly bullish coming on a day where a lower low was seen. Even said, overall technical action continued to remain weak here overall, which is still suggestive of a countertrend rally on this index.As with the SPX, it is possible that the drop from the 1495 swing top made in Friday’s session is a ‘b’ wave affair - with a wave ‘c’ back up to the low 1500 region in the coming sessions. This is valid again provided that the 1458 swing low from last week holds the downside action here - but really today’s low should now not be violated to the downside if this is correct. |
The 1500-151 region again is where the normal statistical rallies have taken this index with the 20 day cycle, and so the index would look best with a test of this region in the coming days. Any move below 1458 thwarts the above analysis and, if broken south, would instead call in a drop towards the 1440-1445 weekly projected support low. Watch price in the coming days.
Jim Curry Market Turns Advisory Email: jcurry@cycle -wave.com Disclaimer - The financial markets are risky. Investing is risky. Past performance does not guarantee future performance. The foregoing has been prepared solely for informational purposes and is not a solicitation, or an offer to buy or sell any security. Opinions are based on historical research and data believed reliable, but there is no guarantee that future results will be profitable. The methods used to form opinions are highly probable and as you follow them for some time you can gain confidence in them. The market can and will do the unexpected, use the sell stops provided to assist in risk avoidance. Not responsible for errors or omissions. Copyright 2004, Jim Curry. | |

Market Turns Advisory 4/5/5
Started by
TTHQ Staff
, Apr 05 2005 03:32 PM
No replies to this topic
#1

Posted 05 April 2005 - 03:32 PM


