

THE CYCLES
We do not often quote long sections from our daily updates in these newsletters. From time to time, however, there are some salient market facts that we want to share with all subscribers, especially those who do not have the benefit of our daily updates. The following quote is from our daily update of Wednesday, March 9th, just two days after the highs were seen in March. As is our wont, we were burning the midnight oil last night examining several charts when we began to make some interesting discoveries.
1) If you draw a tops trendline from the high of March 5, 2004 through the high of January 3rd, 2005, that trendline was at 1,229.15 on March 7th, the day of the recent high on the S&P. The high that day was 1,229.11, virtually a perfect hit of the tops trendline.
2) We were prompted by a recent comment by Steven Hochberg of the Elliott Wave Financial Forecast about recent March turning points to investigate the month of March over the past several years. Here is what we found:
2004-3-5 the high that date lasted eight months
2003-3-12 the low that date has never been penetrated
2002-3-19 the high that date lasted two years and eight months
2001-3-22 the low that date lasted almost six months
2000-3-24 the high that date remains the S&P all-time high
1999-3-3 tthe low that date lasted almost two years
1998-3-5 the low that date lasted almost six months
1997 nothing significant
1996 nothing significant
1995-3-7 the low that date has never been penetrated
1994-3-31 next day lower then never again lower
1993-3-11 the high that date lasted five months
1992 nothing significant
1991-3-1 the low that date has never been penetrated
1990 nothing significant
1989-3-1 the low that date has never been penetrated
3) At that point the only thing that prevented us from thinking March 7th could be a ore important high than we originally thought was the fact that we had slightly higher projections outstanding. That prompted us to revisit those projections. If we used the daily projection charts as opposed to the weekly ones, although the range of projections was very similar to the weekly projections, the lower window of the projections for both the Dow Jones Industrial Average and the S&P 500 was reached at the March 7th highs.
With that information in hand, our update yesterday would have taken on a different coloration. Unfortunately, as we noted above, those discoveries were not made until well after the update was placed on line. Where does that leave us? We should note nothing definitive has yet been decided. It does appear from the above statistics that March shows a strong probability for being an important turning point but it does not tell us whether that turning point might be a high or a low. In order to make that judgment with confidence we will probably have to wait for the month of April to see whether it registers a higher high or lower low than March. There is still a possibility that the full weekly projections will be reached to the upside, but we must now be aware of the possibility that an important top has already been registered.
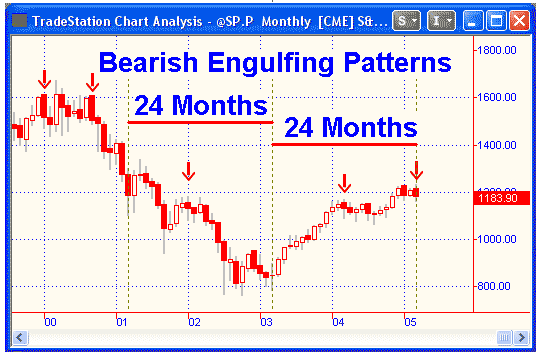
We are writing this newsletter just as the month of March and, therefore, the first quarter of this year has ended. As we noted in the last paragraph of the section of the update quoted above, we will now have to track the month of April for further evidence as to whether March will again be an important turning point and, if so, whether it is slated to be a top or bottom. The chart on page one could be giving us a few clues. It is a monthly Japanese Candlestick chart of the S&P 500 futures contract on a continuation basis. For those of you who are not acquainted with the concept of Japanese Candlesticks, we have reproduced below a brief explanation of the candlestick concept. This explanation is taken from an excellent website called investopedia.com.
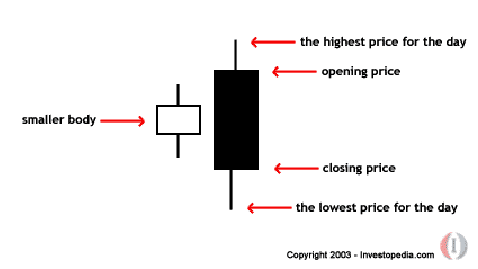
A clear candlestick is formed when the closing price of any bar is higher than the opening price. A colored or black candlestick body is formed when the closing price of any bar is lower than the opening price. The fat body of any bar represents the distance between the opening and closing price. The tails at the top and bottom of each bar represent the distances between the highs and lows of the day and the opening and closing prices. The configuration noted above shows the set up for a bearish engulfing pattern. Investopedia says a bearish engulfing pattern, as implied by its name, may provide an indication of a future bearish trend.
Examine the chart on page one. It is a monthly candlestick chart covering the period of the past six years. We have placed arrows above each of the previous bearish engulfing patterns. Starting on the left side of the chart, the months with bearish engulfing patterns were January 2000, September 2000, January 2002, March 2004, and this past month, March 2005. Notice that in no case after the four previous occurrences did the market show any significant upside potential.
We noted above that we are looking for clues that might suggest whether March 2005 might be a top or bottom. Remember from our recent newsletters that the 5 year within each decade has always been up for more than the past century. In fact, that tendency has been so strong and so amazingly consistent that there has been only one 5 year in the past century that did not produce a higher high in each and every quarter of the 5 year. That year was 1975. Those prior patterns strongly suggest that the April-June quarter of this year will produce a higher high than the March 7th high. On the other hand, the bearish engulfing pattern displayed on page one suggests there is a good chance that pattern will fail this time around. These contradictory technical clues should make the next three months far more interesting than they would otherwise be.
There is another clue on the page one chart that suggests April could be an important month. Notice the horizontal bars that delineate 24 month periods between March 2001-March 2003 and March 2003-March 2005. March 2001 and March 2003 produced prior lows suggests that March 2005 will be a bottom. A bear might argue that the George Lindsay sequence of bottom to bottom equals bottom to top might suggest the exact opposite, namely, that a market top of some importance could be due in March 2005. The month of April could settle the argument. If the S&P 500 moves below its March low it would significantly strengthen the argument that March marked a market top. If, on the other hand, the S&P 500 moves above its March high in the month of April, March could well qualified as a potentially important bottom. As we have noted above, the bearish engulfing pattern suggests the bearish case might win out.
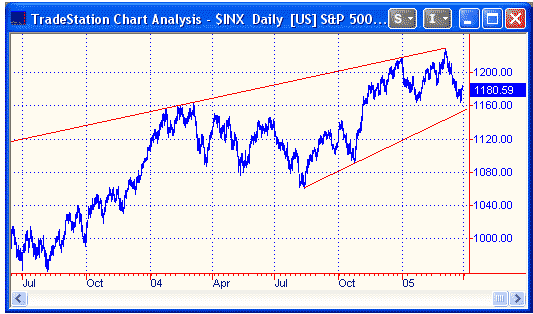
TECHNICAL INDICATORS
In the quote from our March 9th daily update on the front page of this newsletter, we referred to a trendline drawn through the tops of March 5, 2004 and January 3rd, 2005 on the S&P 500 cash index. That trendline is depicted in the chart on page 3. Those who continue to insist that the stock market is a random walk should be placed in isolation for a few weeks and forced to gaze upon this and similar charts. Such trendlines are not, of course, always effective but they are effective and accurate often enough to suggest strongly that they should be constantly sought out and used as guidelines. Using the exact high prices of the above dates and projecting the slope of the line forward mathematically would result in an exact price of 1,229.15 on March 7th. The actual intraday high on March 7th was 1,229.11.
There is nothing to say that the line could not be approached once again or even penetrated but using it as a guideline gave us and other technicians who had observed it a leg up on the random walkers who would have you believe such lines are either nonsense or self-fulfilling prophecies. The other trendline drawn on the chart is an uptrend line through the August 2004 and October 2004 bottoms. Trendlines assume more authority with a greater number of hits than two, but this trendline with only two hits can be used as a guideline as to whether the market is violating its uptrend from the August 2004 bottom.
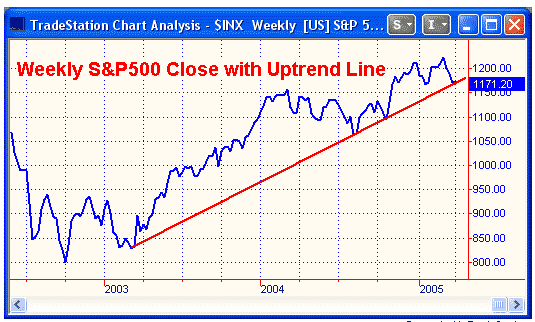
An even greater concern for the long-term bullish case is the uptrend line from the March 2003 weekly close through the August 2004 and October 2004 weekly closes on the S&P 500. The chart on page 4 depicts that trendline which now has three closing weekly lows associated with it. In the week ending this week, April 1st, that trendline is at 1,168.60. On April 8th it will be at 1,171.75. Simply add 3.145 to each succeeding week to determine the price of the trendline at the close of each week. As we write this section of the newsletter with less than two hours remaining in the market day for April 1st, the S&P is just over three points above that longterm uptrend line.
MARKET PROJECTIONS
As we noted in the quote from the March 9th update on the front page of todays newsletter, there were slightly higher projections outstanding as the March 7th highs were being registered. We informed subscribers on March 9th, however, that if we used the daily projection charts as opposed to the weekly ones, although the range of projections was very similar to the weekly projections, the lower windows of the projections for both the Dow Jones Industrial Average and the S&P 500 were reached on March 7th. The weakness in the stock market over the past two weeks is generating preliminary nominal 40 week downside projections for most of the major indexes. The projection for the Dow Jones Industrial Average calls for 9,876.35 ± 115 points. The equivalent projection for the S&P 500 calls for 1,114.66 ± 12 points while the Nasdaq Composite projection calls for 1,810.17 ± 40 points. If the indexes close down for the week on April 8th, the above projections will be confirmed.
[The remainder of Stock Market Cycles, by Peter Eliades, is reserved for subscribers]


