Jump to content


Photo

The Ord Oracle 4/21/05


  • Please log in to reply
No replies to this topic

#1 TTHQ Staff

TTHQ Staff

    www.TTHQ.com

  • Admin
  • 8,597 posts

Posted 21 April 2005 - 07:56 AM

http://www.Traders-Talk.com/gurucharts/ord/050421-1.gif">

*Interview with Ike Iossif on March 31  http://www.marketviews.tv/freeservices/archives1/Guests/Ord/pg1.htm
"TimerDigest" has TimOrd ranked #5 onreturns for the S&P and #2 in Goldfor 2004.

For 30 to 90 days horizon:
Short SPX on 4/14/05 at 1162.­5.
For monitoringpurposes: Long XAU, 87.96on 4/21/04.
Longer Term Trendmonitoring purposes: Short SPX (S&P cash)on 4/12/05 at 1187.76.

What to expect now:

The S&P broke support at the 1165 range(Blue Arrow) on heavy volume and wide price spread (known as "Sign of Weakness")last Thursday and Friday and confirming the intermediate downtrend. Monday the S&Pbroke to a minor low below Friday's low and volume shrank substantially and than closedabove Friday's low, triggering a short term bullish sign.  Today the S&P tested Friday's low again and volume shrank over 15% andsuggests there is support at current levels even though the S&P closed below Friday'slow.  This potential short-term bullish signmay take the S&P back up near the "Break down" area at the 1165 range.  The previous support at 1165 range should nowbecome resistance.  Our bigger time framedownside target would still be the August low near the 1060 range at a minimum andpossibly all the way to down to 950 at the max.  Thenext higher resistance on the S&P is the 1200 range and if the S&P did manage abounce to the gap level at the 1200 range, that case would imply the 1060 range would bethe most likely target for the next intermediate term low.  We are holding our intermediate and longer term short positions on the SPXfor now.

Since Oil sector may have trouble near term, we will hold off on new purchases until OIHtests the 88 range on lighter volume. We are putting on ENG on our watch list, supportnear 2.05.


To learn more on "Ord-Volume" please visit www.ord-oracle.com. 


Nasdaq Composite:
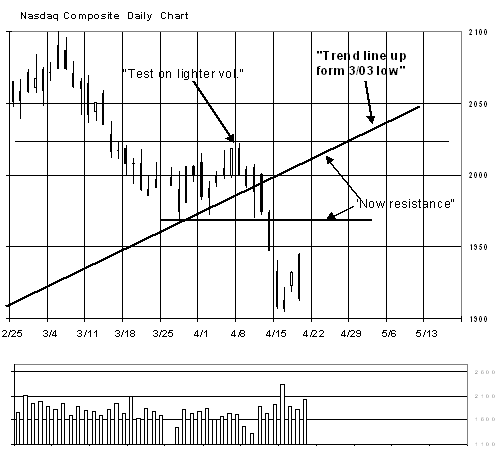
On Monday the Nasdaqtested Friday's low on lighter volume and than closed above Friday's low creating a shortterm bullish sign.  Resistance lies near the1980 and may be the area were the next short term top materializes.  The bigger trend is down on this index also.  We will watch the 1980 area for a potential sellsignal area.  Flat for now.


GOLD Market:

"TimerDigest" has ranked Tim Ord as the #2
goldtimer for 2004.
Short term trade, Long BGO (4/19/05) at 2.37.  This trade is separate from our long term positionin BGO.

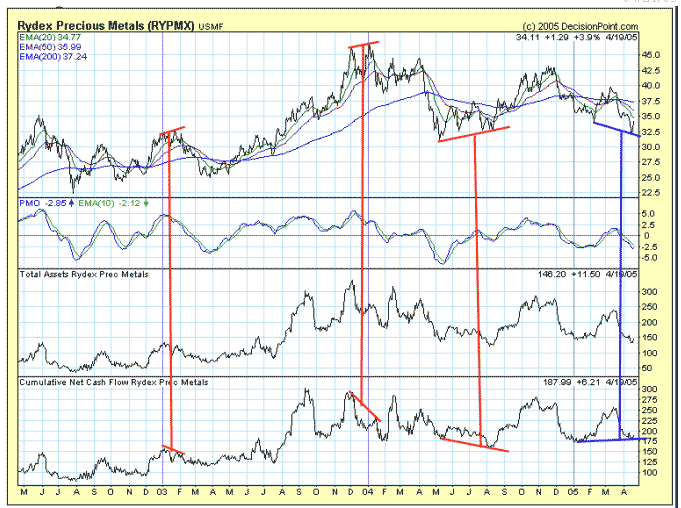
On the last page of this report, you will find the "Rydex Precious Metal Fund". 
On this page at the bottom of the graph is a graphof the Cumulative Net Cash Flow.  What we wantto demonstrate is how Cumulative Net Cash Flow diverges at important turning points inthis market.  We have pointed out severalturning points diverges (both bottoms and tops) denoted in red.  The current diverge is pointed out with bluelines.  The current divergence is a bullishone.
We double ourpositions in BGO on (7/30/04) at 2.34 and we now have an average price at 2.70. Long CBJfor an average of price of 2.75. Long NXG average of 2.26.  Long PMU at average 1.12.

 
The McClellanOscillator closed today's at -88 and oversold for near term.
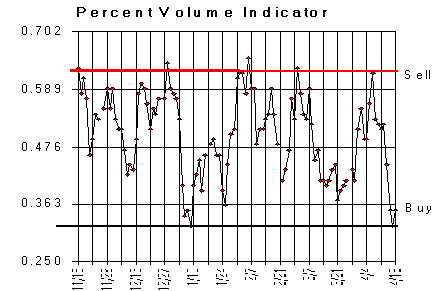
The “PercentVolume” Indicator closed .37 and near the bullish level.
The "5 day ARMS" closetoday at 6.14 and bullish for short term.
Conclusion: Bigger trend on the S&P andNasdaq is down.
Longer Term Trend:Short SPX (S&P cash) on 4/12/05 at 1187.76.


About Tim Ord