
 Institutional Sentiment & Analysis WeekendReport
for the week of May 9, 2005 - May 13, 2005
Short-Term Sentiment:
Positive.
Intermediate-Term Sentiment:
Very Positive.
Intermediate-term Trend:
Buy.
Short-term (one-day) Signal:
Neutral. (last signal Buy 5-4).
Ideal Portfolio:
50% QQQQ.
50% SPY. We may add on weakness.
Results of the Wall Street Sentiment Survey(formerly known as the Fearless Forecaster Sentiment) taken after the close on 5/06/05.
Response was to this question: "At the end of next week will the S & P 500 closeup (bull), down (bear), or unchanged/no opinion (neutral)?"
Weekly BULLS: 46%
Weekly BEARS: 25%
Our `Smart Money' Pollees are as Bullish as they are Bearish and twice as Neutral aseither.
The Senticator is Bullish.
Last time, I said that my call was for a rally up into Wednesday and then a sharp pullback(assuming we are up much) and then rally on and into Friday. We were up into Wednesday,and pulled back on Thursday, but the rally didn't materialize on Friday. Then again, notmuch of a pullback did either. I think we can take an A- for that call, since we were onthe right side of the market for the week.
Last Monday, the Mechanical went long the SPY at 116.07 and blew out at 117.75, and theSubjective model was already long a 1/2 position at 115.50 and 1/2 at 114.91 from theprior week. We blew those out at 117.75 as well. We bought back 1/2 at 117.10, and triedto Sell at 118.10, but couldn't hold the pre open rally. We stopped out at Break even,which is fine considering the outsized gain we nailed down.
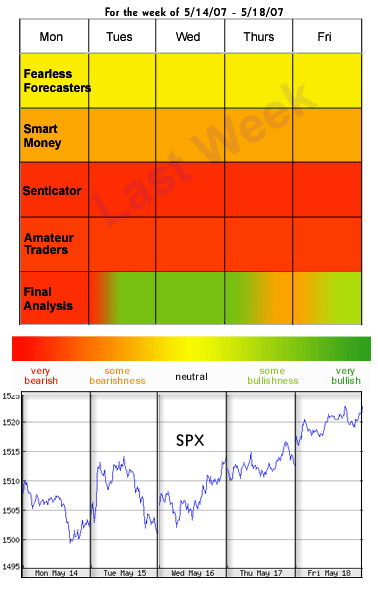 |
The Fearless Forecasters are rather Bullish with the Neutral readings higher than theBears. The "Smart Money" guys are very split. The Senticator is Bullish. I knowfrom experience that when the trend is consistent with the majority of FearlessForecasters, they tend to be right. The data last week left open the chance for a turn,but the poll and survey data that I keep suggests that the little pullback on Friday builtconsiderable pessimism and doubt. Thus, I think that the up trend will likely continue.
The message board sentiment poll has Bulls at 29% and Bears at 44%. That's leaning a bitBearish, which might support a bit more pullback. The Actual Position Poll shows 42% atleast partially long, but 46% at least partially short with 29.17% of the pollees fullyshort. That's a lot of longs, but with so many fully short in a market that hasestablished an up trend, we have to be Bullish. Also, there are more short than longoverall. We probably don't have much to worry about until the fully short Bears fallbeneath 10%.
The equity P/C ratio rose to 0.80 which is neutral. The Dollar-weighted P/C rose to 0.88,which is neutral. The prior 1+ readings are a buy given the MACD confirmation. The OEX P/Cratio fell to 1.29, which is neutral. The CBOE P/C ratio 10-day moving average islingering near 1 at 0.98, which is consistent with an intermediate-term Buy.
Last week, AAII reported 29% Bulls (vs. 29.75%) and 45% Bears (vs. 34.71%). This is greatnews for the Bulls. This strongly implies more upside. Investors Intelligence reported43.5% Bulls, and 30.4% Bears. This is a slow but steady progression of increasedBearishness and decreased Bullishness. This data is still basically neutral, but we areseeing more worry every week. LowRisk reported 22% Bulls, down from 25% last week andBears at 56%, even with last week. This persistent Bearishness is what the Bulls want tosee.
The Rydex Dynamic Bull fund assets increased by just $2MM, while the Dynamic Bearish fundassets decreased by $0.38MM. The shifts were generally rather mixed, with more shifts outof funds than into them. We had decent Bullish shifts in the Dynamic OTC funds but nearlyequal Bearish shifts in the Dynamic S&P funds. Overall, very mixed, much like themarket. The RSO showed a small Bullish shift on mixed market, which is reasonable. Noexcess there. It's consistent with the trend toward higher prices.
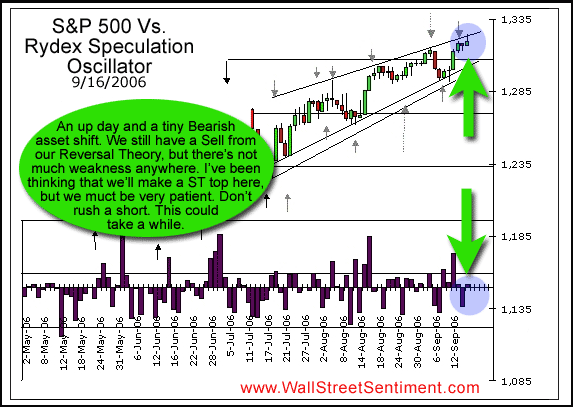 |
The Senticator is Bullish, so again we have look forhigher prices. We got the killer set up from the $-weighted P/C ratio trading over 1.00and $1.7 Bil in Bearish Rydex shifts, and the trend turned up. There's not much of anexcuse not to be long in here, though we are a little bit overbought. What I'm reallyliking is the increasing Bearishness on the rally. Folks don't believe it, and thatimplies that any pullbacks should be bought. My call for the week is generally higherprices, mostly likely up into Tuesday, a pullback Wednesday, a rally on Thursday, and apullback again on Friday. All in all, look for higher prices, but we ought to see at leasta day or two of correction.
 |
The Mechanical model will go long at the open on money on a limit of 117.12, and theSubjective model will go long there as well.
Not everyone likes a short-term trading model, and would like something that hangs onto bigger moves and reflects a less frantic trading pace. If you want to know how I would trade based upon the big picture and the sentiment, the following tracking portfolio is it. Ideal ETF Portfolio (tracking portfolio): 50% QQQQ @ 35.31, or better. 50% SPY @ 116.65 We may even go on margin and add to these positions, as well if we see a pullback. |
Order The Institutional Sentimentand Analysis Weekend Report:
(Yes, we only offer Annual subscriptions to the ISA.
Afterall, it's less than $2 USD per week.)
Or get the Trade Navigatorevery day-
(and get the ISA Weekend Report for free.)
Order The ISA Trade Navigator monthly for $39.99, (orsave 17% and order annually) and get the ISA Navigator Report every morning.
About Mark S. Young


