
S&P 500 CASH
SPX CASH: DailyProjected Support and Resistance levels: High - 1166; Low - 1150
JUNE SP:
SPX CASH:
JUNE SP:
SPX CASH:
SPX CASH:
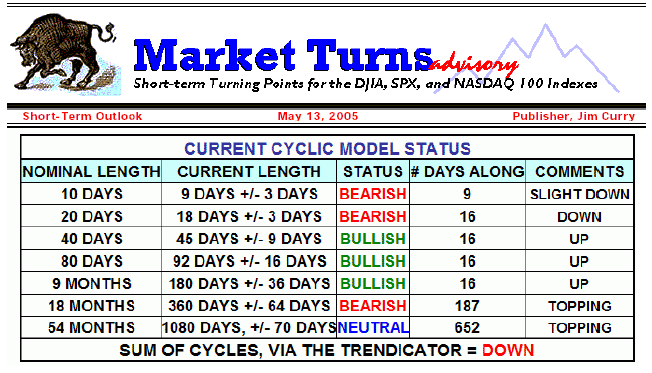
Current SPX Index Positions:
Mid-term (6-8 weeks) = 65% BULLISH from 1167.28 (average price)
Short-term (1 day-3 weeks) = NEUTRAL from 1165.88 (intraday today)
From previous outlook:
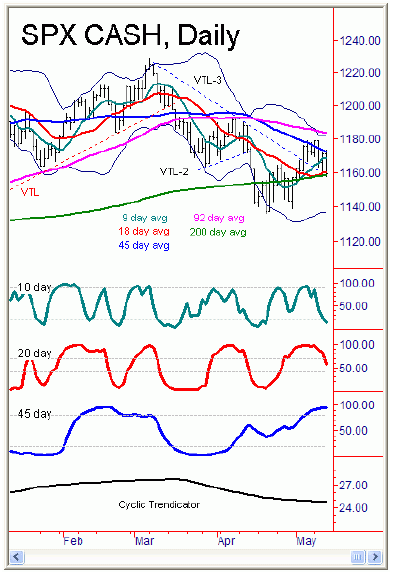
Current analysis: The SPX ended up making a higher high on the dailychart, hitting 1173.37 at the session peak before getting hammered to end the day at ornear the lows. Volume was heavier, coming in at 1.57 billion shares, which is a 10%expansion from yesterday’s levels and can be seen as both bullish and bearish for theshort-term; bullish for the fact that a higher high (above Wednesday’s high) wasseen, but bearish because much of the volume came in later in the day as we were sellingdown into the lows. The notes from last night’s outlook suggested the possibilitythat the low may be in for the week at the 1157.71 swing bottom, and that the 1182area or higher could be tested on the next swing up. I still go with that assessmenttonight, though obviously taking out this 1157.71 swing low would mean that the minor downcycles are still in force. Also, if this number is taken out south, then the odds woulddefinitely begin to increase that the 20 day down phase is in fact in progress, andthat the normal 2.5% drop off the top with this component is in progress. Ideally weshould have seen 1182 or higher before this cycle peaked out, but thus far that has notoccurred - though anything is possible and so we will just have to see how Friday’ssession plays out here.
On our chart above, the 10 day oscillator is now in normal bottomingregion, with the 20 day oscillator looking to be about a day or two away from joining it.The cyclic Trendicator is still pointing lower for now, though you can see that in thelast week or so this indicator has begun to ‘flatten’ out - which will normallyoccur just before a larger trend change is seen (witness the same pattern being seenbefore the March top). For the larger cycles, we still have the outstanding 90 day cycleupside projection to 1200 SPX CASH or higher, which is good through mid-June here and iswhy I used today’s decline to cover some of the short-term bearish positions and thenadd slightly to our existing mid-term bullish trade here. If the current decline shouldcontinue and reach a bit lower levels, then I will begin to aggressively add tomid-term longs in the coming days, as the next swing up should ideally make a stab at the1200 SPX CASH area or higher. More in tomorrow night’s outlook, including an updateon the daily Hurst channels.
NASDAQ 100 CASH
Daily Projected Support andResistance levels: High, 1461 - Low, 1440
5-Day Projected Support and Resistance levels: High, 1480 - Low, 1435
Monthly Projected Support and Resistance levels: High, 1462 - Low, 1353
Current NDX Index Positions:
Mid-Term (6-8 weeks) = 40% BULLISH from 1430.05 Short-term (1 day - 3 weeks) = 130% BEARISH from 1450.00
From previous outlook:
Current analysis: Unlike the SPX, the NDX was actually able to makenew swing highs for the week with the tag of 1468.17 at the session peak - thoughreversing off this same level to end the day on a down note. Volume was also heavier here,coming in at 1.73 billion shares, which is slightly heavier than Wednesday’s numberson this index and is actually more bullish than bearish for the short-term. Since thisindex did actually make new highs for the move, it may be that today’s intraday highwas ‘it’ for the 20 day cycle up phase. Having said that, I would still not besurprised by another try at or above the 1468 area before Friday’s close, as thevolume notes from above tell us that another test of this high is likely. Having said that,the volume was heavier on the 1432 swing low and was also heavy on the 1394 swing low- which still argues that both of these numbers are going to be tested again at some point after the current rally up runs it’s course. With the positions of both of theshort-term daily oscillators on this index, this may not be that far away. Stay tuned.
Jim Curry
Market Turns Advisory
Email: jcurry@cycle-wave.com
Disclaimer - The financial markets are risky. Investing is risky. Pastperformance does not guarantee future performance. The foregoing has been prepared solelyfor informational purposes and is not a solicitation, or an offer to buy or sell anysecurity. Opinions are based on historical research and data believed reliable, but thereis no guarantee that future results will be profitable. The methods used to form opinionsare highly probable and as you follow them for some time you can gain confidence in them.The market can and will do the unexpected, use the sell stops provided to assist in riskavoidance. Not responsible for errors or omissions. Copyright 2005, Jim Curry.


