TDT Report
Friday 27-May-05
12:10 PM ET | Editor: Arthur Hill
arthurh@tdtrader.com
http://www.tdtrader.com |
|
Next Report: Friday 3-Jun-05 |
Market Overview: Strength in Technology continues to drive the market higher. The Nasdaq is poised to challenge its March high, but the NYSE Composite is still getting resistance near its April high. These two broad indices have no overlap (shared stocks) and make for a good comparison. The Technology sector is the key driver for the Nasdaq, while the Consumer Discretionary and Finance sectors are key drivers for the NYSE Composite.
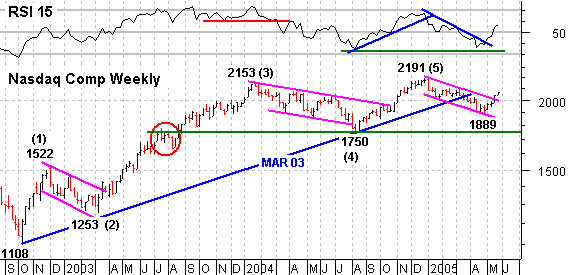
The weekly chart provides a target and the daily chart provides the level at which the current uptrend is proven otherwise. Before moving on, letís review the bullish setup and signal. The Nasdaq retraced 62% of the Aug-Dec advance with a falling wedge and broke resistance with a big surge in May. The late April high and early May consolidation make for a support zone around 1940-1980 and I would expect this area to hold. A move below this support zone would signal a failure and prove the current uptrend otherwise.
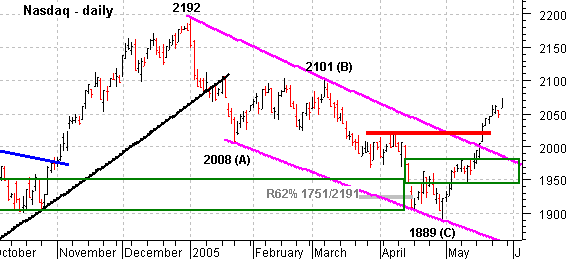
S&P 500: The uptrend in the S&P 500 has slowed since reaching 1163 in Mar-04, but an upward bias is clearly in place. The index forged a higher high at 1229 and found support from broken resistance around 1136. Even though SPX broke the Mar-03 trendline (blue), it has yet to negate the falling price channel breakout that occurred in Nov-04. This breakout occurred after a normal correction and should be respected as long as 1136 holds. I am certainly concerned with the large negative divergence in RSI. However, the indicator is back above 50 and momentum is moving in the right direction Ė for now at least.
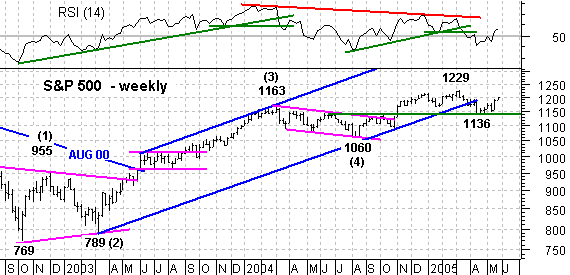
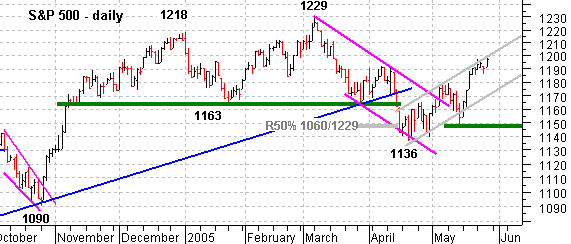
On the daily chart, the S&P 500 is riding on the coattails of the Nasdaq advance. The broader market is not as strong, but the S&P 500 has a large tech component and this carried the index to around 1200. As long as the Nasdaq remains strong, the S&P 500 will be considered bullish. The index broke resistance at 1165 in May, formed a higher low in mid May and moved to a new high this week. The pattern could evolve into a potentially bearish rising price channel (gray trendlines), but this is not a concern as long as the lower trendline and prior low (1145) hold). A move below 1170 would cause concern and a decline below 1145 would be enough to turn bearish again.
SPX Sectors: Strength in Information Technology and HealthCare is enough to keep the S&P 500 afloat. These two sectors account for around 30% of the index and strength in Information Technology is psychologically bullish. HealthCare remains the top performer with a Weighted Average of 97 and Materials are at the bottom with a Weighted Average of 30.
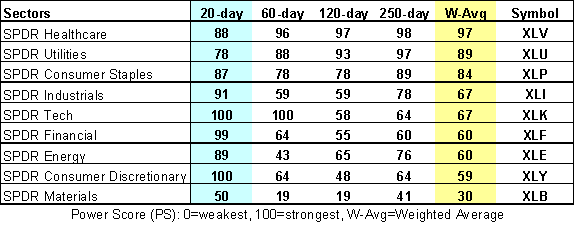
Notice that Information Technology (67) is in the number five spot with four sectors stronger and four sectors weaker. The top three sectors reflect a defensive market over the last six months. However, Information Technology, Consumer Discretionary and Finance have the highest Power Scores over the last 20-days (May). It is clear that Consumer Discretionary and Information Technology are making a run for it and trying to start another leg higher. The key is when Information Technology and Consumer Discretionary break into the top half of the table. The bull will be strong when/if this happens.
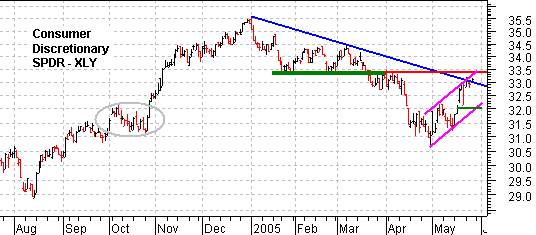
The Consumer Discretionary SPDR (XLY) is at its momentum of truth. The Nasdaq is trading at resistance around 1550, the NYSE Composite cannot break through 7200 and XLY is meeting resistance from broken support at 33.5. The advance over the last three weeks was sharp and formed a potentially bearish rising flag. A return to broken support is the perfect setup for bears looking for a good shorting opportunity. A move above 33.5 would put XLY back on top and boost the bulls. However, a move below 32 would mark a failure at resistance and a continuation lower. I will give the bulls the benefit of the doubt as long as 32 holds.
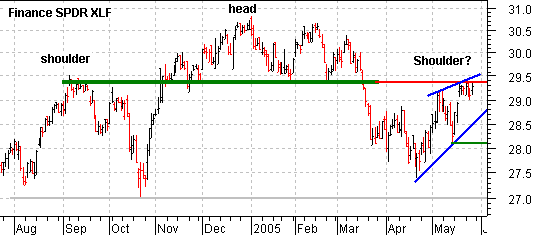
Even though the Consumer Discretionary sector is more important to the economy and overall market, I cannot ignore the Finance sector and its 20% influence on the S&P 500. Just like XLY, the Finance SPDR (XLF) is trading at its momentum of truth. XLF broke support at 27.4 and this level turned into resistance over the last seven days. The advance since late April looks like a rising wedge and this could be bearish as well. A move below 28 would signal a failure at resistance and open the door to a support test around 27. Should this occur, a large head-and-shoulders pattern would evolve and neckline support would reside at 27. As with XLY, I will give XLF the benefit of the bulls as long as support at 28 holds.
Nasdaq Groups: As the Power Score (PS) table shows, all four Nasdaq groups have participated in the May advance. All four groups recorded Power Scores of 100 for the last 20-days and 60-days. This is the kind of participation required to sustain an advance.

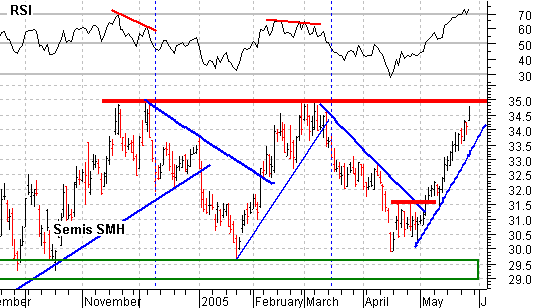
Even though all four groups are important, the focus remains on Semiconductors. The Semiconductor HOLDRS (SMH) has been in a trading range since October and is closing in on resistance. The stock is up around 15% this month and RSI just moved above 70. This is not enough reason to turn bearish or consider shorts, but should curtail longs and increase the chances of a consolidation. Notice that negative divergences in RSI foreshadowed the prior highs (red lines) and it took a move below 50 for confirmation (blue dotted lines). Even though RSI is overbought and trading at a 52-week high, I think this attests to the strength of the current rally and is more bullish than bearish. A move above 35 in the stock would break resistance and this would be mighty bullish for the Nasdaq and tech overall.
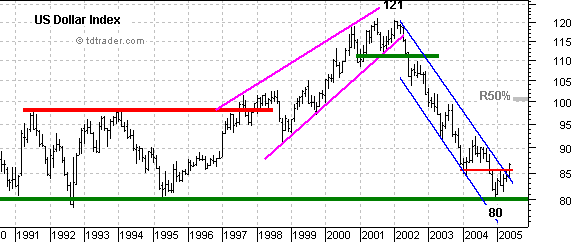
US Dollar Index: France goes to the polls on Sunday to vote on the EU constitution. Current polls indicate that the nonís (no) out number the ouiís (yes). In addition, the Dutch vote on 1-Jun and current polls also suggest that the noís will win. While I do not think this will spell the end of the Euro or European Union, it cannot be positive and could exert more downward pressure on the Euro. It is unclear how much is already priced in. Should the yes votes win in France, the Euro would most likely rally. Looking at the monthly US Dollar Index chart, we can see that the index bounced off support at 80 and broke above resistance at 85.5. Even though this may be a bear market rally, the current advance could retrace 38-50% of the prior decline and extend to around 95-100. Gold has clearly benefited with the move from 121 to 80 and will likely suffer on further strength.
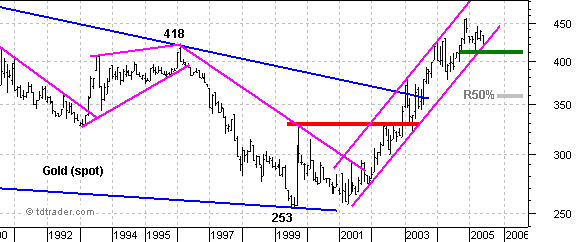
Gold: While the US Dollar Index has already broken to the upside, Gold remains in an uptrend. Bullion rose from 260 to 460 during the Dollarís decline and formed a rising price channel. Gold is currently testing the lower trendline and further weakness below 410 would break the four year rising price channel.
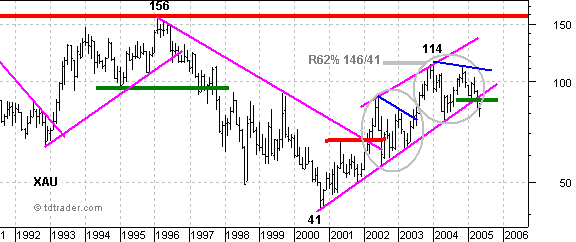
XAU: The monthly chart for XAU is clearly bearish and leading gold lower. After a decline from 156 to 41, the index formed a rising wedge or price channel advance to 114. This advance retraced 62% of the prior decline and the setup is classic. XAU broke the lower trendline and is on the verge of breaking the 2004 low. As far as I am concerned, a continuation lower is in progress and I would expect further weakness towards 65 over the next few months.
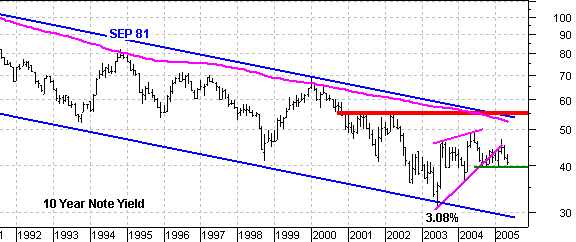
Interest Rates: The 10-year T-Note Yield (TNX) bounced off support at 4% in February and March, but failed to hold these gains and is trading at 4% support once again. Even though the 20+ year trend is still down, the medium-term outlook is about as clear as the FOMC minutes. When in doubt, it is best to defer to the longer and clearer trend, which is down. The advance from 3.08% formed a rising wedge and TNX broke the lower trendline. Further weakness below 4% would send rates back towards 3%. I am watching 4% support quite close as there could be a bounce. However, I need to see a strong bullish catalyst before taking a bounce seriously. This means that the outlook for bonds (TLT) remains bullish until proven otherwise.
PSS World Medical (PSSI): I am still inclined to pick stocks from the strongest sector (HealthCare) and maintain a defensive market stance. With that in mind, PSSI came across my stock scans with a recent breakout on good volume. PSSI is a specialty marketer and distributor of medical products, supplies and equipment. The stock has a forward PE of 18.5 and a PEG of 1.20. PSSI has relatively little debt and revenues are slated to grow 15% year on year.
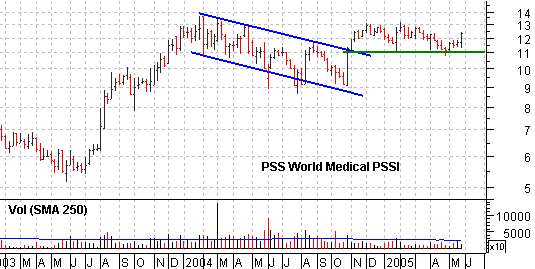
On the weekly chart, the stock has followed the market quite closely. There was a sharp advance in 2003, a correction in 2004, a bottom in Aug-04 and a pullback in 2005. The 2004 decline looks like a falling price channel and the breakout is bullish. Broken resistance around 11 turned into support and the stock held this level in January and April.
On the daily chart, the stock surged in October and then corrected from December to May. A falling price channel formed over the last few months and the stock broke resistance with a high volume surge this week. This is not the first high volume surge as the stock managed three gains on good volume in May. This solidifies support around 11 and the breakout opens the door to higher prices in the coming weeks.
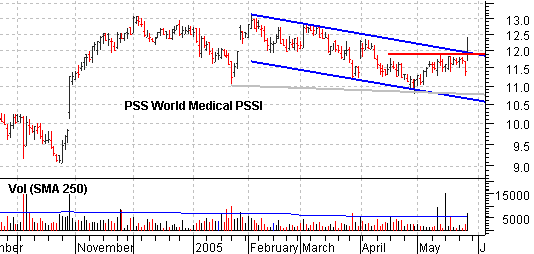
Based on its sector (HealthCare) and the chart breakouts, I will add PSSI to the Model Portfolio (currently around 12). A re-evaluation will be set on a close below 11.
Model Portfolio: The broader market is at a crossroads. What else is new?! Seriously, the Information Technology sector is in the middle of the sector performance table. The top is dominated by the defensive sectors (HealthCare, Consumer Staples and Utilities). The bottom features the Consumer Discretionary and Finance sectors. As long as the Consumer Discretionary sector lags and sits in the bottom half of the table, I will maintain a defensive stance towards stocks. The recent surge in Information Technology is quite positive, but a one horse race is not enough to pull the broader market higher and lift all boats.
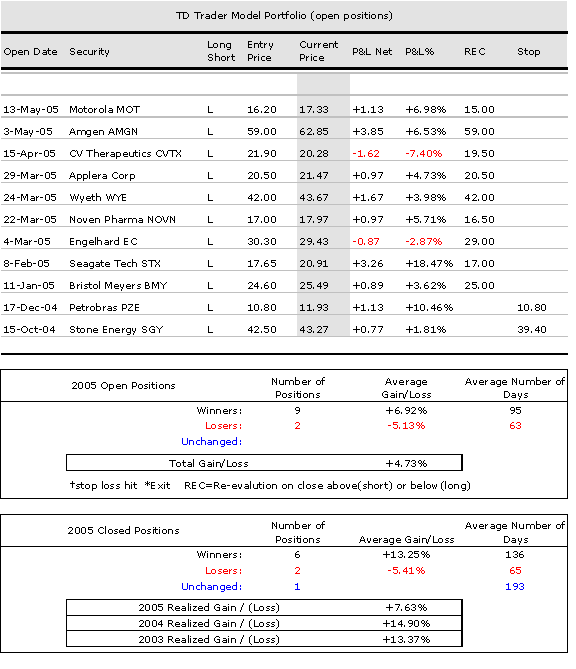
Model Portfolio Notes: L = Long Position, S = Short Position, Qty = quantity of shares, REC = Re-evaluation close (close below REC for longs and close above REC for shorts), SL = stop-loss. This is a hypothetical portfolio based on even dollar amount of $10,000 per position. $20 was subtracted to cover round trip commissions. This portfolio is meant for educational purposes and should not be considered a recommendation or solicitation to buy, sell or short these securities.
About: The TDT Report consists of a brief update on Tuesdays and a full report on Fridays. For shortened weeks (4 days or less), there will only be one report on the last day of the week. Changes to the Model Portfolio and major indices are sometimes necessary between scheduled updates (Tuesday and Friday). As such, additions, deletions and/or updates to the Model Portfolio may sometimes be emailed between reports. These will also be added to the website.
Disclaimer: Arthur Hill is not a registered investment advisor. The analysis presented is not a solicitation to buy, avoid, sell or sell short any security. Anyone using this analysis does so at his or her own risk. Arthur Hill and TD Trader assume no liability for the use of this analysis. There is no guarantee that the facts are accurate or that the analysis presented will be correct. Past performance does not guarantee future performance. Arthur Hill may have positions in the securities analyzed and these may have been taken before or after the analysis was present.
Power Score: The Power Score (PS) is based on absolute strength and this can be compared against other securities for an idea of relative performance. The Power Score (PS) measures the strength of a particular security for a given time frame: 20-day, 60-day, 120-day and 250-day. These are trading days and roughly equate to 1, 3, 6 and 12 month periods. A weighted average of the four Power Scores is then calculated with 12-months weighing the most and the 1-month weighing the least. In general terms, readings above 55 are bullish and readings below 45 are bearish. The zone between 45 and 55 is a transition area that can go either way. About Arthur Hill
Reply to quoted posts Clear
- Traders-Talk.com
- → TTHQ Directory
- → Market Analysis Area
-
Privacy Policy
-
Terms/Privacy Policy ·
|


