

STEPHEN TODD
REGISTERED INVESTMENT ADVISOR 26861 TRABUCO RD. SUITE E 182
COMMODITY TRADING ADVISOR
JUNE 2005
PHONE 949 581 2457
MISSION VIEJO, CA 92691
www.toddmarketforecast.com
ISSUE 6 YEAR 21
E-MAIL STVD@COX.NET
INTERMEDIATE TERM STILL LOOKS HIGHER
The main reason that we are positive on the stock market is liquidity, in other words, money. There is a lot of cash in the hands of potential investors
We show this in chart form in the issue of February 2005. If you are a new subscriber and haven't seen that issue, e-mail us and we will provide you with a copy.
There in no law that says substantial portions of this massive amount of money with find its way into stocks, but history says that it will.
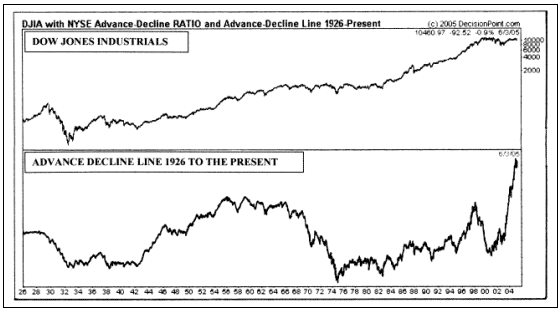
There are other reasons for our bullishness. Look at the chart directly below, courtesy of Decisionpoint.com. Here we see the advance decline line going back to 1926. Notice how strong surges in this indicator portend strength for years to come. Notice also how the weakness from the mid sixties to the mid seventies was accompanied by a market that went nowhere.
The major bear market from 2000 until late 2002 was preceded by a massive drop in the indicator from 1998 until almost 2001.
Now look at it. There are no guarantees in this business, but we strongly suspect that the best breadth surge in eighty years is predicting
--- something more than additional market weakness. We also suspect that it will turn down well before any long term market decline sets in.
Yes, we know. This is the NYSE advance decline line and it includes a lot of interest sensitive stocks such as preferreds. But this, in our opinion, isn't relevant. It simply means that long term interest rates are also coming down and this has historically been a positive for stocks.
Some are saying that what we have seen over the past couple of years is a cyclical market rebound within the confines of a long term bear market. Somehow we have a hard time conceiving of a long term bear accompanied by all time highs in the advance decline line and almost record high liquidity.
Also, it's not time for even a cyclical bear market. The average cyclical bull since the end of World War II has lasted 39 months. Another average performance would take us to early 2006.
Also, don't forget the fact that no year ending in five has been down in over 120 years. The average gain has been 31%. Since we are still down for the year on most indices, it would appear that we have some catching up to do.
MORE MARKET ANALYSIS
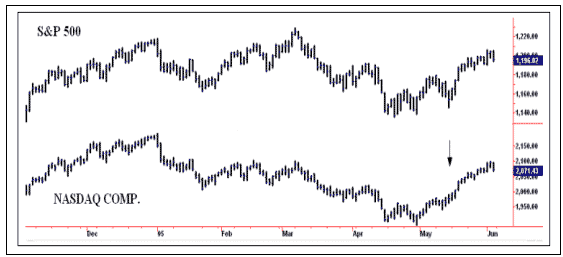
One of the things that temporarily moved us to the bearish camp last February was the poor performance of the Nasdaq Composite versus the S&P 500. Take note of the all time high for the S&P in early March. The Nasdaq was nowhere near comparable levels.
The best markets are those in which the major indices are moving up together and our personal favorite is when the Nasdaq is doing the leading. This index, with it's heavy flavoring of high tech stocks, was relatively weak for much of this year, but that seems to have changed. Look at the arrow. Note how a sell off by the S&P was shrugged off by the more speculative Nasdaq.
We suspect that this condition will last for quite a while now that it seems to have turned around and it should make for a more healthy market environment.
AN END TO FED TIGHTENING?
We are starting to hear talk of an end to the tightening cycle by the Federal Reserve. After a few weeks of such speculation by traders and commentators, Fed Governor Richard Fischer joined in last Wednesday and opined that we may be in the "eighth inning" of rate increases. For our foreign subscribers, this means that it's almost over.
In the past, when the tightening period ceased, stocks have tended to do very well. So far, the Fed has increased short term rates 8 times in a row. Prior to that, the most increases over the past 15 years was 7 in a row ending in early 1995. Right after that, you might recall, the stock market embarked on one of the truly great uptrends in its history.
Of course, we can't say for sure if the rate increases will end, but look at a couple of facts. Long term rates have totally ignored the Fed action. The return on the thirty year bond is very close to a record low.
If the Fed keeps on raising rates, at some point short term yields will be greater than long term returns which would give us an inverted yield curve. This in turn, has been associated with recessions. Greenspan retires in a few months and since he probably doesn't want to harm his legacy, we suspect that he will err on the side of helping the economy.
Isn't it too bad that we even have to worry about the Federal Reserve? If there was ever a useless and harmful institution it is this one. The original mandate was to provide liquidity in case of financial panic. This was in response to the panic of 1907 when J.P. Morgan had to rescue the country by locking bankers in a room until they agreed to provide loans.
The first real chance that they had to show their wares was the crash in 1929 and they failed miserably. Instead of providing liquidity, they cut the money supply back. Just the wrong thing to do in a recession which quickly turned into a depression.
They have so many cockeyed ideas, it's hard to know where to begin. The most wrong headed fixation is the notion that economic growth causes inflation. No it does not and I can prove it to anyone who will listen. If you go look at periods of strong growth, you will find that these were also periods of low inflation. Look at the 1920s, the 1950s and the early first half of the 1960s. Major growth periods all and almost totally lacking in inflationary pressures.
On the other hand, periods of poor growth have been associated with high inflation. Exhibit one is the mid seventies. Economists called it "stagflation" as if it was some sort of anomaly, but it was not.
Inflation is accurately defined as "too many dollars chasing too few goods" The phenomenon of "too few goods" is what you get in an economic slowdown.
Look around the world. Nations with high inflation tend to be also economic basket cases like Iran and some South American countries. There is a famous picture of a man in the Weimer Republic of Germany during the late 1920s. He is pushing a wheelbarrow full of marks. Was this condition because of a strong economy?
BONDS AND SENTIMENT
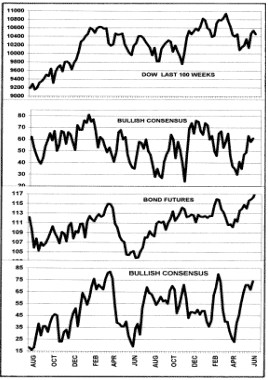
The Bullish Consensus is a survey by Consensus Inc of Kansas City MO. It tallies the sentiment of analysts and newsletter writers and like any crowd, they tend to be wrong at extremes. The second chart below monitors stocks, while the fourth chart monitors the bond market.
The Bullish Consensus for stocks was recently oversold and did indeed give us a bit of a rally, but it appears, based on previous experience that we are owed somewhat more of an uptrend than we have thus far experienced. Also, the current level isn't yet overbought so this should give us a bit more on the upside.
The consensus for bonds, on the other hand, is --- showing quite a bit of optimism, in fact, too much optimism. The last two times it was this high, bonds took a tumble. However, the chart of bonds can only be described as bullish at the present time.
OTHER MARKETS
We are currently bearish on gold. We have been in this posture since the close of April 14 of this year.
We are bullish on the greenback and bearish on the Euro. This has been the case since the close on March 22 of this year..
We remain bullish on Treasury Bonds which is where we have been since the close on April 11 of this year.
PUT CALL RATIO
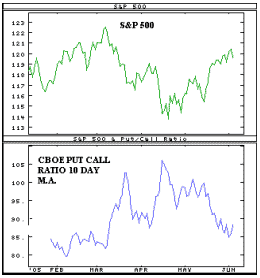
Recently, we have had to generate much higher put call ratios to generate rallies and it will bear watching because this is a bear market phenomenon. In a bull market, readings of above .80 tend to be bullish, but not lately. Is there some sort of structural change going on or is it trying to tell us something? We'll go with the former, but it does raise our antennae a bit. Stay tuned.
Right now, the ratio is approaching the level that coincided with the last multi week decline that started in early March.
NEWS AND THE MARKET
(1) On January 4, the minutes from the last Fed meeting surprised the market by expressing concern about the future of inflation.
(2) On January 13, a sharp upmove in the price of crude oil depressed the stock market.
(3) On January 21. Michigan sentiment was lower than expected.
(4) On Jan. 21, the Michigan sentiment survey was lower than expected.
(5) On Feb. 16, Greenspan suggested that the economy was good with low inflation.
(6) On Feb. 22, Korea supposedly said that they wanted to diversify from dollars and oil was up over 5%.
(7) On March 8, It was reported from the floor of the NYSE by CNBC reporter Bob Pisani that floor traders weren't worried about the market..
(8) On March 17, the market tried to rally, but a surge in oil retarded things.
(9) On March 29, the Dow dropped 80 points for no particular reason.
(10) On April 7, Crude oil dropped 3%.
(11) On April 15, IBM reported poor earnings and there was a slew of poor economic news.
(12) On April 21, the Dow rallied 206 points on great earnings news and solid economic reports.
(13) On May 9, the market rallied sharply, most likely in a delayed reaction to the unemployment numbers released the day before.
(14) On May 13, the Michigan sentiment numbers were lower than expected and dropped for the fifth month in a row.
(15). On June 3rd, the unemployment statistics were much worse than expected and this caused a solid market decline.
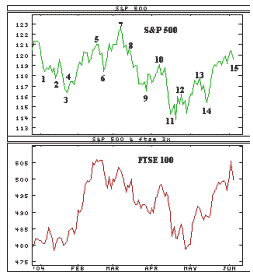
THE LONDON MARKET
London stocks were weaker than their U.S. counterparts from mid February to late April, but have since curled up and become stronger.
They recently reached the February highs while the S&P 500 are considerably lower than comparable highs. This is solid performance, but now they are at what appears to be major resistance.
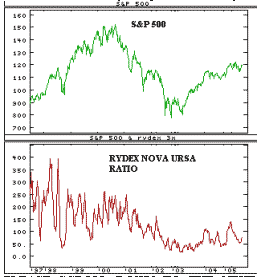
NOVA URSA RATIO
The ratio of Nova (bullish funds) to Ursa (bearish funds) continues to show bearishness and this should be a positive from a contrary opinion standpoint.
Note that we have had a solid uptrend for the S&P since early 2003, but the Rydex investors haven't bought into it in a major way. They are still quite suspicious and this should be an intermediate to longer term positive.
As we have said in the past, we think this particular sentiment gauge is more worthwhile than most. Unlike surveys, it shows what investors are actually doing with their money.
The Dow has recently rebounded from its downtrend, but the chart pattern isn't saying much. Basically, waffling around.
Sentiment, as measured by Investors Intelligence is showing relative bearishness. This should be a positive.
The Investors Intelligence Oscillator, which measures the percentage of NYSE stocks above their own 10 week m.a. is turning up from a very oversold condition.
The American Association of Individual Investors survey is also very oversold. This should be a major help going forward.

The Dow has had a nice rebound and is now hesitating at previous resistance.
The five day m.a. of five day RSI is curling down from an overbought condition. This is a bearish development.
The Dow advance decline line is basically following the Dow. This isn't telling us much at present.
The Value Line net change five day moving average is basically in a neutral condition at the present time.

The Dow has bounced nicely, but it now hesitating. We wouldn't be surprised by a bit of a retracement.
The advance decline ratio is curling down from a very mildly overbought condition. This is a mildly bearish condition.
The PSE net change 10 day m.a., is currently back in a neutral condition and isn't telling us much.
The Supply Demand 10 day m.a. is curling down from a sharply overbought condition. This is a bearish situation.
QQQQ, SPY AND FUNDS
We did not make any short term ETF trades during the month just past.
Track Record
Even if they were right about inflation, economists at the Fed have the wrong cure. Raising short term rates doesn't cure inflation. It actually makes it worse. Here's why. Corporations fund their day to day operations with short term borrowing. If rates rise, this increases their cost of doing business. They then have to raise prices or cut back production, both of which are inflationary. Only an economist could believe that raising the cost of doing business could cure inflation.
Dont' get us wrong. There are good economists. Men like Larry Kudlow and Arthur Laffer generally know of what they are talking, but they are few and far between.
RANDOM THOUGHTS
The previous comments lead us to another scary scenario. Lately, we have been hearing talk of a housing bubble and how the brilliant minds at the
Fed should take action. Even normally sane publications like the Wall Street Journal have gotten the fever. They say that the Fed missed the stock bubble of the late 1990s and that they need to make up for it by stopping the housing price spiral.
Really? Do we want bureaucrats and Soviet style central planners deciding if stock prices or home prices are too high? Do we really want to interfere with the market mechanisms? Besides, how would they do it? By raising mortgage rates and throwing first time home buyers out? There's an old saying, "When you kick a stone down the hill, a lot more winds up at the bottom than you might expect.
INTERMEDIATE TERM FUND SWITCHERS
From Nov 3, 1993 through April 21, 2005, the S&P gained 697 points. Our timing captured 914 points or 131% of the buy and hold. It was enough to rate us # 1 by Timer Digest for the latest 10 year period.


