TDT Report
Tuesday 14-Jun-05
10:50 PM ET
Editor: Arthur Hill
arthurh@tdtrader.com
http://www.tdtrader.com
Next Report: Friday 17-Jun-05
Even though I view the May advance and breakout as bullish for stocks, the major indices are at important resistance levels and the intermarket picture is disconcerting. This could lead to some softness.
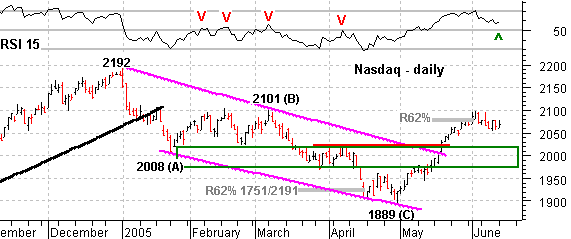
The Nasdaq led the market with a sharp advance that began in late April. With a 200 point (10%) rally in just five weeks, the Nasdaq became overbought and met resistance from its Feb-Mar highs (~2100). Also notice that the advance retraced around 62% of its prior decline. The index has since moved into corrective mode and could have further to correct. A typical correction would see RSI move to 50 and the index decline to 2020, which is the top of the support zone.

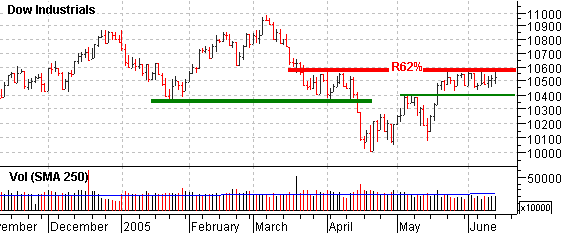
Looking at the Dow chart, it is easy to see why the bears are so bearish. The average broke support at 10360 in mid April and the current advance retraced 62% of the prior decline. In addition, the average is meeting resistance from its early April highs and failed to follow through on the mid May surge. While the pattern over the last four weeks looks like a flat flag, a move below support at 10400 would be quite bearish and open the door to a support test around 10000. We should watch 10400 closely.

The intermarket picture is not conducive for a sustained advance in stocks. First, oil remains high and comfortably above $50. Second, the 10-year T-Note Yield fell sharply over the last few months and this should not happen when the economy is supposed to be “ok”. In addition, the yield curve is flat and this hurts banks. Third, gold and gold stocks are starting to perform well. What’s most impressive is that this strength coincides with strength in the US Dollar Index.
Bottom-line: the May breakouts are still holding and we have yet to see any absolute weakness. A lot may depend on oil and the Dow. Should oil continue to move higher and the Dow breaks support at 10400, the outlook for stocks would turn negative.
Position Summary
-Nasdaq Composite: Bullish with support at 1940
-S&P 500: Bullish with support at 1145
-TBond ETF (TLT): Bullish with support at 93
-US Dollar Index: Bullish with support at 85
-GLD: Neutral with support at 41.3 / 410
-XAU: Bearish with resistance at 90
-Oil: Bullish with support at 44
Until Friday -Arthur Hill
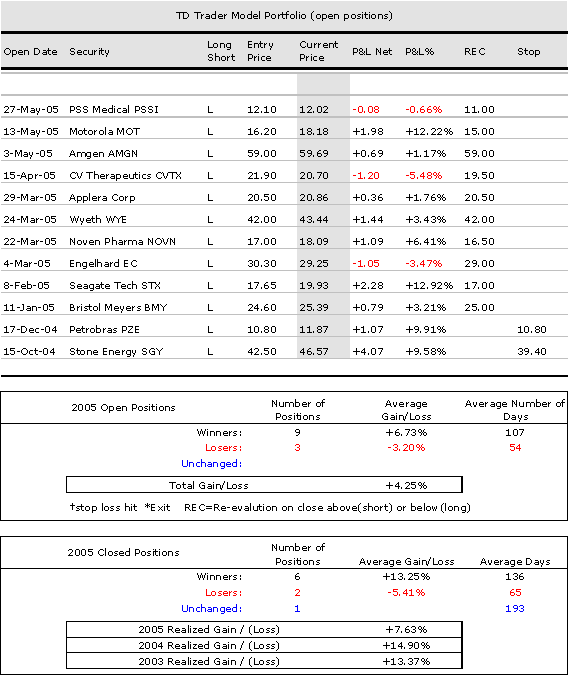
Model Portfolio: No change: Stocks look vulnerable to further weakness or consolidation and I will keep the Model Portfolio as is. The Energy SPDR (XLE) and Oil Service HOLDRS (OIH) are strong and this could continue to take the wind out of an overbought market. The top sectors are Utilities, HealthCare, Consumer Staples and Energy. The Model Portfolio is weighted towards HealthCare and there are two Energy holdings.

About Arthur Hill
Model Portfolio Notes: L = Long Position, S = Short Position, Qty = quantity of shares, REC = Re-evaluation close (close below REC for longs and close above REC for shorts), SL = stop-loss. This is a hypothetical portfolio based on even dollar amount of $10,000 per position. $20 was subtracted to cover round trip commissions. This portfolio is meant for educational purposes and should not be considered a recommendation or solicitation to buy, sell or short these securities.
About: The TDT Report consists of a brief update on Tuesdays and a full report on Fridays. For shortened weeks (4 days or less), there will only be one report on the last day of the week. Changes to the Model Portfolio and major indices are sometimes necessary between scheduled updates (Tuesday and Friday). As such, additions, deletions and/or updates to the Model Portfolio may sometimes be emailed between reports. These will also be added to the website.
Disclaimer: Arthur Hill is not a registered investment advisor. The analysis presented is not a solicitation to buy, avoid, sell or sell short any security. Anyone using this analysis does so at his or her own risk. Arthur Hill and TD Trader assume no liability for the use of this analysis. There is no guarantee that the facts are accurate or that the analysis presented will be correct. Past performance does not guarantee future performance. Arthur Hill may have positions in the securities analyzed and these may have been taken before or after the analysis was present.
Power Score: The Power Score (PS) is based on absolute strength and this can be compared against other securities for an idea of relative performance. The Power Score (PS) measures the strength of a particular security for a given time frame: 20-day, 60-day, 120-day and 250-day. These are trading days and roughly equate to 1, 3, 6 and 12 month periods. A weighted average of the four Power Scores is then calculated with 12-months weighing the most and the 1-month weighing the least. In general terms, readings above 55 are bullish and readings below 45 are bearish. The zone between 45 and 55 is a transition area that can go either way.
About Arthur Hill


