June 15, 2005

Daily Trades (Futures)
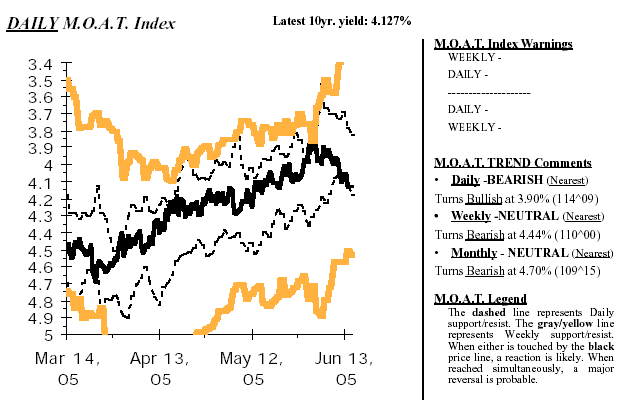
Notes have decisively broken Daily support in the 113^00 area, setting them on a new course for the next few weeks. Downside potential has fallen to 110^00, but currently no safe approach to entry is possible. Letís give Notes a few days to get their footing; we may attempt a Short position soon.
Weekly Trades (Futures/ETFís)
Due to the size of the decline off Juneís high, I can confidently say Notes will remain below 114^20 for several weeks or more. Weekly support is very strong at 110^00, but wave structure suggests a low close to 111^00 is most likely. Stand aside until next week while we wait for safer trading conditions.
Monthly Trades (ETFís/Funds)
A 1-2 month correction has probably begun, so be prepared for a drop to 112^00 or less in June or July. Following that period of reaction, expect to see Notes move toward 120 into the end of this year or by mid next year. In a month or two, we will add to our current Long position if prices are right.
Trade: Long 1/3 Funds on May 18
Stop: 109^15 in nearest future
Target: 120 in 6-12 months
* No Change since last update *


S&P 500
June 15, 2005

Daily Trades (Futures)
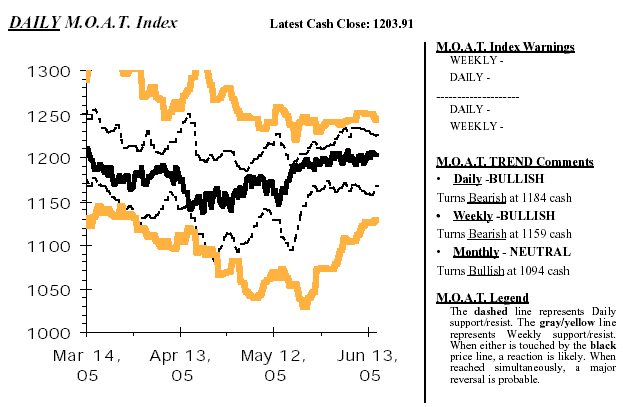
A tight trading range, coupled with low volatility for nearly a month, is setting the stage for a powerful advance into late June. Internal structure is unclear and appears unfinished; as a result, we cannot enter the S&P just yet, but may have a buy signal in the next few days. Trade: Stay out until next update
Weekly Trades (Futures/Index)
Our Buy order was not reached last week, so we remain Flat on this time frame. The S&P is becoming increasingly susceptible to a selloff, so letís lower our 1/3 Long entry point to 1175 with a stop at 1139 in the Sep. contract. The same strategy could be used for index trading. 1150 is major support. Trade: BUY 1/3 @ 1175 or lower
Stop: 1144 Sep. Target: 1275 in 8-12 weeks * No Change since last update *
Monthly Trades (Index/Funds)
Until Weekly and Monthly wave structure clear up, price potential in the S&P is as high 1250 and as low as 1150 during the next 2-3 months. Until one of those two levels is reached, trading on this time frame carries a lot of risk. Enter orders to Buy 1/3 Long at 1161 cash with a stop at 1129. Trade: BUY 1/3 @ 1161 cash Stop: 1129 cash Target: 1275-1300 in 4-8 months * No Change since last update *


GOLD
June 15, 2005

Daily Trades (Futures)
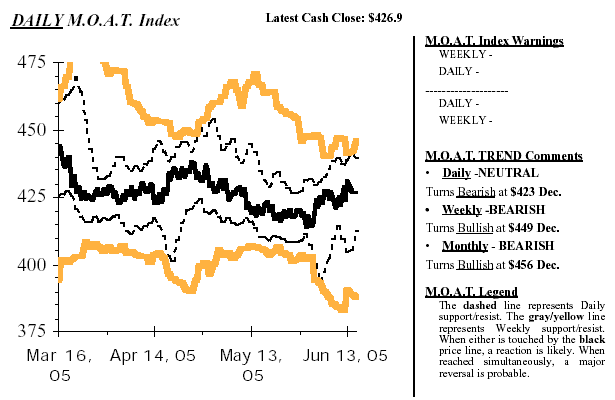
Based on NEoWave theory, it appears a weak Flat (Irregular Failure) started at the mid-April low. If correct, wave-c is forming an Impulsive advance off Mayís low.Wave-4 of that advance is forming now with one more, small rally due for wave-5. Stay tuned for a major shorting opportunity next week.
Trade: Short 1/3 @ $431.50 Dec.
Stop: $440.10
Target: $415 in 10-20 days
Weekly Trades (Futures/ETFís)
It is time to start positioning for an expected large, multi-month decline in Gold. Enter 1/3 Short at $438 Dec. (or higher) with a stop at $449. If we get in, sometime next week I expect we will add another 1/3 and by late June I plan to be fully Short Gold for a decline well below $400.
Trade: SELL 1/3 @ $438 Dec.
Stop: $449 Dec.
Target: Below $400 in 8-12 weeks
Monthly Trades (ETFís/Funds)
The NEoWave CHART service made some adjustments to Weekly wave structure that will temporarily impact monthly behavior. Expect Gold to hold most or all of June; afterward, if Juneís low is broken, it will kick off the largest, fastest decline in the precious metal we have seen in years!
Trade: Short 3/3 since May 12
Stop: $456 basis Dec.
Target: $360 in 6-12 months
* No Change since last update *


EURO
June 15, 2005

Daily Trades (Futures)
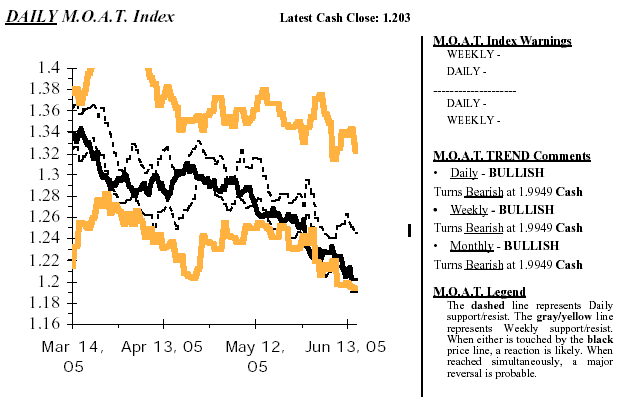
The M.O.A.T. Index shows the Euro very oversold on both a Daily and Weekly basis. Going Short, under such conditions, is out of the question and going Long is risky until some evidence of a low is in place. The best strategy at this time is to stay out, but watch for increasing volatility (a sign of reversal).
Trade: Stay out until next update
Stop:
Target:
Weekly Trades (Futures/FX)
After a couple of weeks of extremely sensational news on the international front, the Euro is highly susceptible to an island reversal bottom. Therefore, letís lower our entry point to 1.2301 Sep. on a buy-stop-limit with a stop at 1.1949. If the order is activated, you may be shocked by what happens.
Trade: BUY 3/3ís @ 1.2301 BSL
Stop: 1.2149 Sep.
Target: 1.3000 in 5-10 weeks
* No Change since last update *
Monthly Trades (FX)
Last week we increased our position to 3/3ís Long when cash was trading near 1.2200. That puts our overall, average entry at 1.2633 cash. Iíve lowered the stop slightly to adjust for recent increases in volatility. Wave structure shows wave- B could end anytime and that a large C-wave rally will start soon.
Trade: Long 3/3 @ avg. 1.2633
Stop: 1.1949 cash
Target: 1.4000 in 4-8 months
* No Change since last update *


About Glenn Neely's Trading Services and Charts


