S&P 500 CASH
SPX CASH: Daily Projected Support and Resistance levels: High - 1209; Low - 1202
SEPT SP: Daily Projected Support and Resistance levels: High - 1215; Low - 1208
SPX CASH: 5-Day Projected Support and Resistance levels: High - 1212; Low - 1195
SEPT SP: 5-Day Projected Support and Resistance levels: High - 1216; Low - 1199
SPX CASH: Monthly Projected Support and Resistance levels: High - 1223; Low - 1169
SPX CASH: Yearly Projected Support and Resistance levels: High - 1292; Low - 1135
Current SPX Index Positions:
Mid-term (6-8 weeks) = 50% BULLISH @ 1171.13 (took partial exit at 1207.07)
Short-term (1 day-3 weeks) = NEUTRAL @ 1206.04 (intraday today)
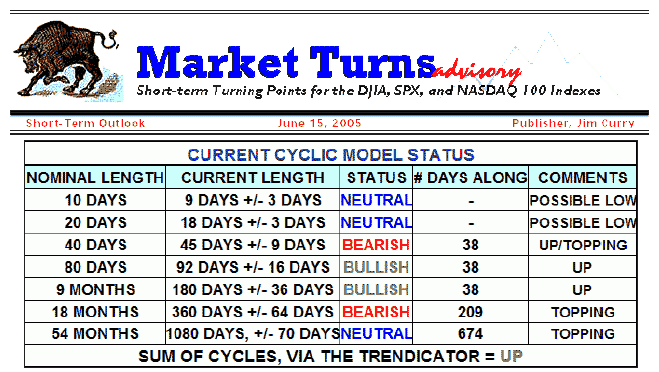
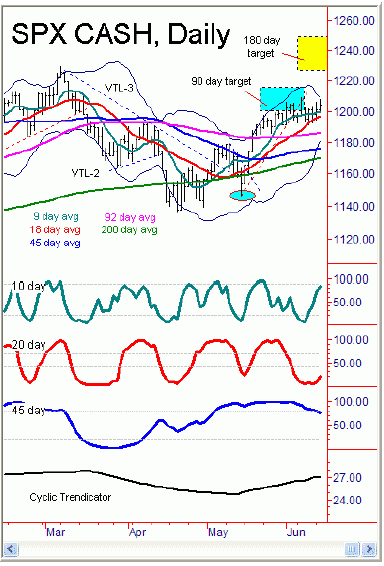
From previous outlook: “the short-term action is still fuzzy to me, and there are times when making ‘no call’ on the market is actually the best call to make; this may be one of those times. However, for some speculation, the fact that the most recent 18 hour cycle registered both a higher low and a higher high can be a ‘hint’ that the larger 10 and 20 day cycles have already bottomed at the 1191.09 swing low seen last week; thus, I have labeled both of these cycles right now as ‘neutral‘ on our cyclic table, as I am still uncertain of their exact position here other than to note a ‘possible‘ low in place for each. Right now though to actually confirm a 10 and 20 day bottom in place the index would actually have to take out the 1208.85 swing top that was made on 6/7/05 - which is the last swing peak for the move. Should that occur, the probabilities would be better-than-average for a continued push on up to the 1216 area or higher in the coming days. Thus, anything below the 1208.85 area and you can assume that there is still the possibility that new lows below 1191.09 could still be out there in the coming days on this index.”

Current analysis: The SPX registered another higher low and higher high on the daily chart, hitting an intraday peak of 1207.53 before ending the day off session highs. Volume was slightly heaver today, coming in at just over 1.3 billion shares - which is about a 4% expansion from Monday’s levels and tends to confirm the rally up thus far.
As per the notes from last night, there is the possibility that the 10 and 20 day cycle lows are in place at the 1191.09 low seen on 6/9/05. The best confirmation of this would again be a break back above the 1208.85 high seen last week; if seen, the minimum expectation would be for a move on up to the 1216 area or higher - while the odds would be better-than-average that we would go ahead an push on up to the 180 day target of 1224 or higher, as 85% of the 20 day cycle up phases that have both higher lows and a higher high have witnessed rallies of 2.7% or greater before peaking out. In terms of time, when the 20 day cycle makes this higher low/higher high pattern the odds favor a rally in the 7 trading day range off the bottom (92% odds), with the greater majority of these (85%) actually having seen their rallies lasting 8 trading days or more before peaking out.

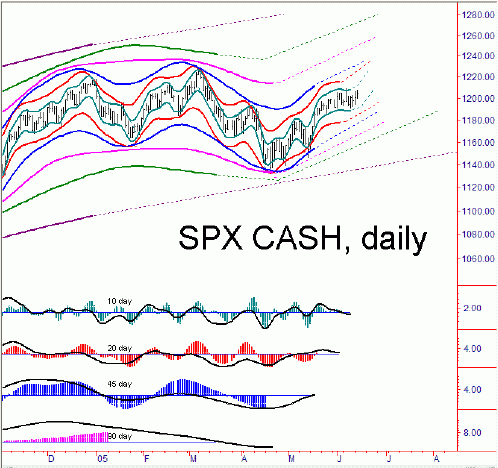
Interestingly here - and adding to the above information with the 20 day cycle - we are possibly already 3 trading days along to the upside with this component at today’s close. A 7-8 trading day rally would target June 20-21st before a peak with this cycle is seen, while the information from the larger 45 day cycle indicates low-odds of making it’s own peak past the June 20-24th time region. In other words, if 1208.85 were to be taken out higher in the coming days (which is still up in the air right now) then it looks like the 45 day cycle could be setting up for a peak right at or into this June 20-24, 2005 date range. Having said all of the above, anything below 1208.85 here and the index could actually still make a slingshot back to the low end of the range (1185-1191), as the Bollinger bands on the daily chart continue to suggest an index entrenched in a consolidation pattern for now. The channel chart shown above ‘suggests’ how the action could play out if the 1208.85 swing top were to be taken out higher in the coming days, which would show a run on up to the 1216-1224 region or higher before a larger top is seen with the 45 day cycle. Stay tuned.
NASDAQ 100 CASH
Daily Projected Support and Resistance levels: High, 1529; Low - 1516
5-Day Projected Support and Resistance levels: High, 1540 - Low, 1496
Monthly Projected Support and Resistance levels: High, 1615 - Low, 1479
Current NDX Index Positions:
Mid-Term (6-8 weeks) = 40% BULLISH from 1430.05
Short-term (1 day - 3 weeks) = NEUTRAL
From previous outlook: “Today’s trading did not clear up the picture for the short term, though the early-week rally into the weekly projected resistance high may be viewed as slightly more bearish than bullish here. This may be especially true due to the fact that the McClellan oscillator here has yet to make it to or below the zero line on this swing down, which I would certainly like to see it do for my work. In other words, I cannot rule out the possibility of lower swing lows being seen here in the coming days, though even if seen any new downside should be fairly limited overall due to the fact that both the 10 and 20 day price oscillators are in solid oversold region.”

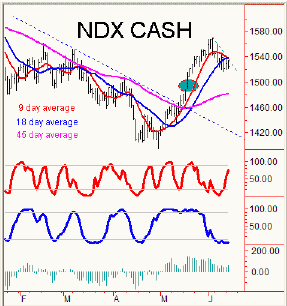
Current analysis: Unlike the SPX, the NDX did not make a higher high on the daily chart in today’s session, instead opting to hold below Monday’s 1538 swing top and make
yet another shot at the low end of the range. Volume came in at again right at the 1.4 billion share mark, which does not help us out in assessing short-term direction here.
All in all there is still not a lot to add here tonight in regards to this index, other than to repeat some of the notes from recent outlooks. The 20 day oscillator is still in oversold region - while the smaller 10 day oscillator is starting to move back towards topping range. The McClellan oscillator on this index has yet to move below the zero line here, which it will normally do as the 20 day cycle is bottoming out on this index. All of the above are continuing to give mixed indications here as to whether the low for the 20 day component on this index is in place. But, even said, I think the short-term downside is fairly limited with price and time if a minor low is in fact still out there on this index in the coming days.
Jim Curry
Market Turns Advisory
Email: jcurry@cycle-wave.com
Disclaimer - The financial markets are risky. Investing is risky. Past performance does not guarantee future performance. The foregoing has been prepared solely for informational purposes and is not a solicitation, or an offer to buy or sell any security. Opinions are based on historical research and data believed reliable, but there is no guarantee that future results will be profitable. The methods used to form opinions are highly probable and as you follow them for some time you can gain confidence in them. The market can and will do the unexpected, use the sell stops provided to assist in risk avoidance. Not responsible for errors or omissions. Copyright 2005, Jim Curry.


