Great Expectations: This is just a heads up to inform you that my wife is 38+ weeks pregnant and due 6-September. The baby could come any day now and I will be “on call” until then. Depending on the timing and labor, this may result in one or two day delay in the TDT Report. Stay tuned….
Market Overview: It’s a right mess out there right now. The market does not know if it is coming or going – over the short-term at least. Techs and the Nasdaq corrected over the last few weeks, the Dow has traded flat and the broader market has been quite soft. As a result, falling wedges or flags have taken shape in a number of indices, stocks and ETFs.
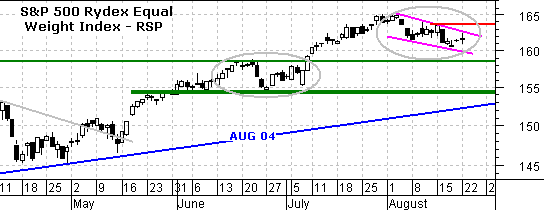
The falling flag or wedge is a corrective pattern that forms within a larger uptrend. Using the S&P 500 Equal Weight Index (RSP) as an example, we can see that stocks advanced from late April to late July (~3 months). This sets the stage of the larger uptrend or primary trend. There were corrective periods in June and again in August (gray oval).

As long as these flags and wedges decline, stocks have yet to break their fall and we should err on the side of caution. The larger trends are bullish and there is no reason to turn bearish. However, these corrections have further room to run and could extend a few more weeks. For example, RSP could extend to broken resistance around 158 (-2%), S&P 500 could correct to 1200 (-1.8%) and the Nasdaq could correct to 2100 (-2%). It is time to wait it out.
Position Summary
-Nasdaq Composite: Bullish with support at 2039
-S&P 500: Bullish with support at 1188
-TBond ETF (TLT): Bearish with resistance at 94.25
-US Dollar Index: Bearish with resistance at 91
-GLD: Neutral/Bullish with support at 43.15 / 434
-XAU: Bullish with support at 93
-Oil: Bullish with support at 55
Until Friday -Arthur Hill Next: Full Report on Friday 26-Aug
----------------------------------------
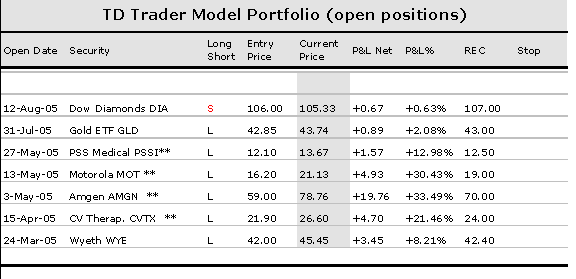
Model Portfolio: I added a couple of defensive positions over the last few weeks: short DIA and long GLD. These bets have less risk than a short in QQQQ or a long in NEM, but also less upside potential. I usually err on the side of risk control and these positions fit my modus operandi.
The sector picture has become clouded recently as HealthCare came under pressure with the Vioxx ruling. Even though this is company specific, the threat of a knock-on affect is keeping the sector under pressure. In addition, Merck is a big fish and weighs heavily. I am noticing that LLY gapped up off support today with good volume. This is due to positive trial results of a diabetes drug. The stock had performed quite poorly the last few months and I will wait to see some follow through before considering a long position. Other than that, it is the dog days or summer.


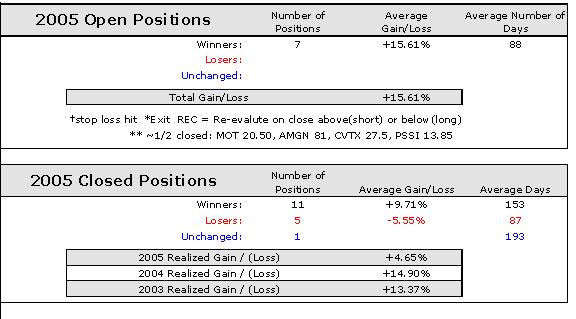
Model Portfolio Notes: L = Long Position, S = Short Position, Qty = quantity of shares, REC = Re-evaluation close (close below REC for longs and close above REC for shorts), SL = stop-loss. This is a hypothetical portfolio based on even dollar amount of $10,000 per position. $20 was subtracted to cover round trip commissions. This portfolio is meant for educational purposes and should not be considered a recommendation or solicitation to buy, sell or short these securities.
About: The TDT Report consists of a brief update on Tuesdays and a full report on Fridays. For shortened weeks (4 days or less), there will only be one report on the last day of the week. Changes to the Model Portfolio and major indices are sometimes necessary between scheduled updates (Tuesday and Friday). As such, additions, deletions and/or updates to the Model Portfolio may sometimes be emailed between reports. These will also be added to the website.
Disclaimer: Arthur Hill is not a registered investment advisor. The analysis presented is not a solicitation to buy, avoid, sell or sell short any security. Anyone using this analysis does so at his or her own risk. Arthur Hill and TD Trader assume no liability for the use of this analysis. There is no guarantee that the facts are accurate or that the analysis presented will be correct. Past performance does not guarantee future performance. Arthur Hill may have positions in the securities analyzed and these may have been taken before or after the analysis was present.
Power Score: The Power Score (PS) is based on absolute strength and this can be compared against other securities for an idea of relative performance. The Power Score (PS) measures the strength of a particular security for a given time frame: 20-day, 60-day, 120-day and 250-day. These are trading days and roughly equate to 1, 3, 6 and 12 month periods. A weighted average of the four Power Scores is then calculated with 12-months weighing the most and the 1-month weighing the least. In general terms, readings above 55 are bullish and readings below 45 are bearish. The zone between 45 and 55 is a transition area that can go either way.
About Arthur Hill


