

Today's WrapUp by Ike Iossif 08.30.2005
HUI - XAU

In our previous report for the Gold Mining Stock Indices, we said:
"The index has broken above 2 resistance lines and it is getting ready to challenge the third one at 220, while both the ADX and the Aroon Indicator are on a "BUY" signal. If the pattern continues to hold, we ought to see a pullback lasting between 2-6 days, and then another push to the upside."
Let's see where we are now:

Although we had to adjust the angle of ascend to a less steep one, the original pattern and the expectations arising from it remain intact. As long as the HUI doesn't violate the 200-198 support zone, the outcome that is illustrated on the chart remains the most probable one. If the HUI closes below 198, then we will have to re-evaluate.

We must admit that we are not very thrilled with the current price action in the metal. The sideways consolidation has the appearance of a continuation flag, implying the potential for a decline to 425.

Notice that the XAU rallied up to the support line that it violated in April, and as one would have expected, it pulled back from it. Our expectation is that it will overcome the resistance imposed by the previous support line, and if our expectation turns out to be correct, then in all likelihood the rally will continue until the XAU makes contact with its upper 50 week volatility band, near the 110 level. The rationale behind such further speculation has to do with the XAU's cyclical tendency to make contact with its upper 50 week volatility band every 12-14 months. We are 10 months into the cycle, thus, within the next 2-4 months--assuming the cycle is not broken--we ought to expect another contact.

If the XAU is going to try again to take out resistance at 100.5, the most common course of action would be to use the 38.2% Fib level as the "launching pad" for the attack. Therefore, it will pull back to the 92-91 zone, and then from there, it will reverse powerfully to the upside. If the 91 level fails to contain the price, then we will have to re-evaluate at that point.

The SI25 is near the zero line, which is where one would expect this indicator to be if the XAU is going to mount another challenge to resistance in the 100.5-101 zone.

Momentum is near the zero line, which is where one would expect this indicator to be if the XAU is going to mount another challenge to resistance in the 100.5-101 zone.

The Thrust Oscillator is near the bottom of its range and it has turned up, which is what one would expect this indicator to be doing if the XAU is going to mount another challenge to resistance in the 100.5-101 zone.

The Buy/Sell Equilibrium Index is near the bottom of its range and it has turned up, which is what one would expect this indicator to be doing if the XAU is going to mount another challenge to resistance in the 100.5-101 zone.

The McClellan A-D Oscillator is near the bottom of its range which is where one would expect this indicator to be if the XAU is going to mount another challenge to resistance in the 100.5-101 zone.
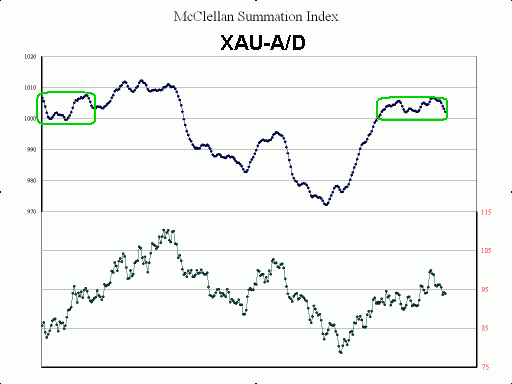
The A-D Summation Index has formed a very similar pattern to the one that accompanied the rally in late July, early August of last year.

Notice that the A-D line has formed a very similar pattern to the one that facilitated the sharp advance of 2003.

The McClellan Volume Oscillator is near the bottom of its range which is where one would expect this indicator to be if the XAU is going to mount another challenge to resistance in the 100.5-101 zone.
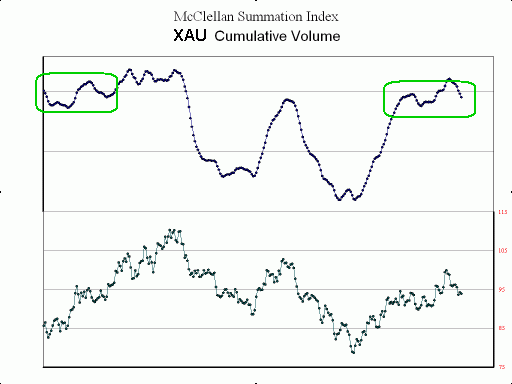
The Volume Summation Index has formed a very similar pattern to the one that accompanied the rally in late July-early August of last year.

Notice that Cumulative Volume has formed a very similar pattern to the one that facilitated the sharp advance of 2003.

The Volume Thrust Oscillator has formed a very similar pattern to the one that facilitated the sharp advance of 2003.

Notice that the trend has turned "NEUTRAL" which is where one would expect this indicator to be if the XAU is going to mount another challenge to resistance in the 100.5-101 zone.

The only indicator that has acted "out of place" and not at all in sync with the overall technical picture painted by the rest of our "diagnostic tools" is the Hi-Low index. This indicator tells us--on a cumulative continuous basis--if at the end of the day the price closed near its high, or near its low for the day. Notice that for the past three weeks, on average, price has closed near its low for the day, although one wouldn't suspect that, looking at the cumulative price action of the XAU Index. Usually, that is not a good sign because it indicates that--on balance--investors are dumping gold stocks going into the last hour of trading. Institutional investors tend to do most of their selling during the last hour of trading, which implies that institutions are selling while individuals are buying. This indicator tends to give some pretty good warnings well in advance, so let's keep that in mind.
CONCLUSION
All the indicators have formed patterns that three out of five times turn out to have a bullish resolution. In fact, the very same patterns were observed last year between late July and early August as the HUI and the XAU embarked on a 20% rally; and they were also observed during the 2003 rally. Our expectation is that the XAU will pull back to the 92-91 zone, which represents a triple support point, and if it holds, we will see a reversal to the upside that will carry the XAU to its upper 50 week volatility band around 110-112.
If support doesn't hold and the XAU declines below 90, then we will wait to see where it finds support and then we will re-evaluate.
Currently, in our gold stock portfolios we have long positions in stocks such as ABX, NEM, BGO, AUY, and we are also long the Sep100 and Sep95 puts, which we are planning to sell when the XAU reaches 92-91 and it reverses to the upside.
Ike Iossif
Copyright © 2005 All rights reserved.


