Jump to content


Photo

HUI Chart


  • Please log in to reply
5 replies to this topic

#1 SilentOne

SilentOne

    Member

  • Traders-Talk User
  • 3,452 posts

Posted 31 August 2005 - 04:47 PM

just watch this chart. It could be explosive from here.

http://www.capitalst...st&id=50453.gif

Chart borrowed from a Stoolie.

cheers,

john

Edited by SilentOne, 31 August 2005 - 04:51 PM.

"By the Law of Periodical Repetition, everything which has happened once must happen again and again and again-and not capriciously, but at regular periods, and each thing in its own period, not another's, and each obeying its own law ..." - Mark Twain

#2 dougie

dougie

    Member

  • Traders-Talk User
  • 9,071 posts

Posted 04 September 2005 - 04:47 PM

LET ME BE THE FIRST 9odly) to say, GREAT CALL! now what?

just watch this chart. It could be explosive from here.

http://www.capitalst...st&id=50453.gif

Chart borrowed from a Stoolie.

cheers,

john

<{POST_SNAPBACK}>


#3 SilentOne

SilentOne

    Member

  • Traders-Talk User
  • 3,452 posts

Posted 04 September 2005 - 05:08 PM

Hi Dougie,

I think the HUI uptrend channel as drawn is good to go. I think, as Senor has been posting, that a major wave III in the HUI has started. We obviously need to break to new highs for that to be confirmed. But from here, if you are not long, buy the pullbacks when they come. We most likely are now in a 3rd wave of this recent uptrend from the May low.

Posted Image

cheers,

john
"By the Law of Periodical Repetition, everything which has happened once must happen again and again and again-and not capriciously, but at regular periods, and each thing in its own period, not another's, and each obeying its own law ..." - Mark Twain

#4 PorkLoin

PorkLoin

    Member

  • TT Member*
  • 2,194 posts

Posted 05 September 2005 - 01:36 PM

Well, who knows -- maybe silver doesn't have to lead gold. Or, since it did gain a little on gold in the last week, maybe things have changed. The COT certainly isn't infallible, and the Commercials can cover. It's still a very good question, IMO.

[attachment=3563:attachment]

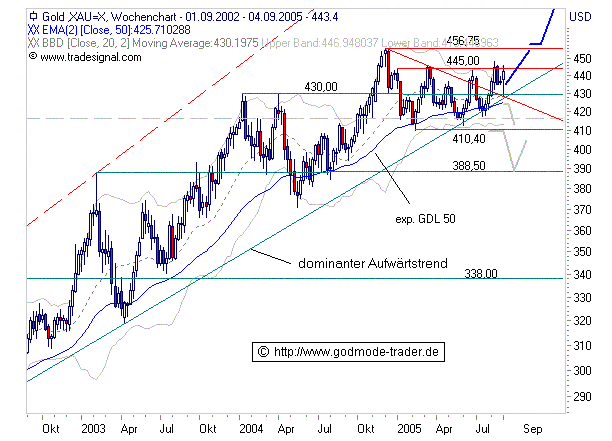
Could be very bullish here -- could be a big 3rd wave coming up. I think that eventually we'll get a continuation of the considerable move into the late 2003 high (as the Dollar bear market resumes in earnest). The weekly RSI has stayed decently strong, over all -- consistent with an ongoing bull market. My question is if the next big wave up is soon, as the above count implies, or later, if we're making a triangle where'd we'd have to complete a fairly big "E" wave or even a "D" wave from the May 2005 low followed by "E." So, what does the move up from May really look like?

[attachment=3564:attachment]

Overall, I think the move from May looks better as three waves, as the light purple line. Same for the XAU, and this makes me reluctant to fully embrace the bull case. But it also can be counted as a decent five waves up, as the red numbers. If we're indeed bullish from the May low, then we should rally impulsively, and decline correctively, so let's look at the action in the last month.

[attachment=3565:attachment]

We should know more pretty soon, since the launch up lately was only a little more than two days' duration. Any correction should be short-lived. Nothing is without doubt or without risk here -- one could count a small "A" and "B" on Sept. 30 followed by a five-wave "C" up, but that looks low probability to me. The decline from the August top can also be counted as a five-wave impulsive move, but that would have to be reconciled with the apparent five-wave rally last week and whatever comes next in the short-term.

If we're bullish and we get a corrective move sideways or down from last week's peak, it should be followed by another good move up, almost surely taking out the August peak. Then the question is if we're just finishing up the rally from May or if we're heading for the 2004 and 2003 highs.

Best,

Doug

Edited by PorkLoin, 05 September 2005 - 01:41 PM.


#5 dougie

dougie

    Member

  • Traders-Talk User
  • 9,071 posts

Posted 05 September 2005 - 09:54 PM

I am trying to reconcile the bullish count ot new highs with a scenario taht THEN sees a serious sell-off for a month or two.
gold to silve r ratio is to be watched.....

Well, who knows -- maybe silver doesn't have to lead gold.  Or, since it did gain a little on gold in the last week, maybe things have changed.  The COT certainly isn't infallible, and the Commercials can cover.  It's still a very good question, IMO.

[attachment=3563:attachment]

Could be very bullish here -- could be a big 3rd wave coming up.  I think that eventually we'll get a continuation of the considerable move into the late 2003 high (as the Dollar bear market resumes in earnest).  The weekly RSI has stayed decently strong, over all -- consistent with an ongoing bull market.  My question is if the next big wave up is soon, as the above count implies, or later, if we're making a triangle where'd we'd have to complete a fairly big "E" wave or even a "D" wave from the May 2005 low followed by "E."  So, what does the move up from May really look like?

[attachment=3564:attachment]

Overall, I think the move from May looks better as three waves, as the light purple line.  Same for the XAU, and this makes me reluctant to fully embrace the bull case.  But it also can be counted as a decent five waves up, as the red numbers.  If we're indeed bullish from the May low, then we should rally impulsively, and decline correctively, so let's look at the action in the last month.

[attachment=3565:attachment]

We should know more pretty soon, since the launch up lately was only a little more than two days' duration.  Any correction should be short-lived.  Nothing is without doubt or without risk here -- one could count a small "A" and "B" on Sept. 30 followed by a five-wave "C" up, but that looks low probability to me.  The decline from the August top can also be counted as a five-wave impulsive move, but that would have to be reconciled with the apparent five-wave rally last week and whatever comes next in the short-term.

If we're bullish and we get a corrective move sideways or down from last week's peak, it should be followed by another good move up, almost surely taking out the August peak.  Then the question is if we're just finishing up the rally from May or if we're heading for the 2004 and 2003 highs.

Best,

Doug

<{POST_SNAPBACK}>


#6 PorkLoin

PorkLoin

    Member

  • TT Member*
  • 2,194 posts

Posted 06 September 2005 - 06:18 AM

I am trying to reconcile the bullish count to new highs with a scenario that THEN sees a serious sell-off for a month or two.  Gold to silver ratio is to be watched....


Dougie, if we're making a first wave up from the May low, the first of another big five-wave sequence higher, like we had into the 2003 high, then when it's done we could retrace the whole thing, in theory, and still have the bull count be okay. It'd be unusual, but not impossible. We could also just retrace a lesser Fibonacci percentage, as often happens, and still do just what you said -- see new highs followed by a serious sell-off.

If you just mean new highs above August, then we could still be in a triangle from 2003, going up in "D" while staying below the two prior big tops, with "E" yet to come. E waves are often sharp and accompanied by news.

I agree on the Gold/Silver ratio, and think that COT considerations have merit.

Best,

Doug