
SENTIMENT IS NEGATIVE WHICH IS POSITIVE FOR STOCKS.
Logic tells us that it's human nature for investors to become bullish at tops and bearish at bottoms. We want to add a codicil to this. If the stock market rallies and people remain bearish, this is a good sign for further strength.
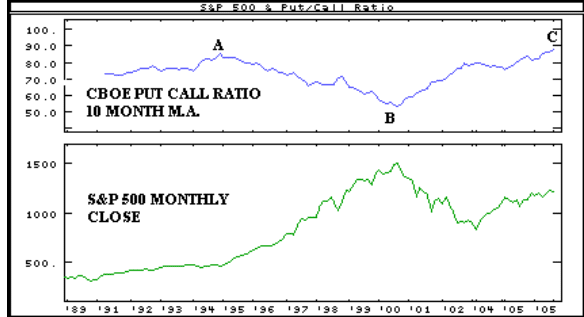
In this regard, look at the chart on the bottom of this page. We have a monthly chart of the S&P with a ten month moving average of the CBOE put call ratio.
At location "A" on the chart, the ratio was very high at well over .80. This bearishness was caused by the choppy market of 1994 along with the relentless Fed rate increases. It's no wonder that soon after, a major uptrend began.
Several years later at location "B", investors had become more complacent with the ratio below .60. It's no coincidence that the stock market began an extended decline. Of course, it was exacerbated by 9/11.
In late '02, as the ratio again moved to .80, the market began an extended recovery. We recognized this at the time as our December, 2002 letter was entitled, "A NEW BULL MARKET."
But look at the ratio now. In spite of an extended move to the upside, the ratio is the highest it has been in decades, even higher than the peak in 1994.
This dovetails with another sentiment gauge on page 4, the Rydex Nova Ursa Ratio. In both cases, investors are resisting joining the uptrend because of distrust. History tells us that this is a good sign. If everyone were joining in and singing the praises of the market, there would be reason to worry.
Think about it. It has to be this way. Imagine a world in which the majority is correct about the direction of stocks. Investors would recognize bottoms and go long and they would pinpoint tops and either exit or go short. Everyone would get rich. But wait! Who would be the seller at these so called bottoms? Who would be the buyer at tops? Everyone would be in agreement.
It doesn't work that way. Be assured that at stock market bottoms, there will be plenty of people willing to sell their stock and at tops, there will be a plethora of willing buyers. Be a contrarian. Lean into the wind.
Real estate isn't immune to this phenomenon. It just seems to be because the cycles are much longer. Right now, "everyone" is recognizing at there is a real estate bubble and what "everyone" recognizes, frequently turns out to be false. There are times when the majority is right. Also, men never walk on the moon, well, almost never.
MORE MARKET ANALYSIS
We haven't shown a chart of gold in recent months, even though a lot of clients are interested in the yellow metal. We will start looking at this market at bit more in the future.
Just looking at the chart doesn't give us much to go on. It has essentially been in a sideways -----
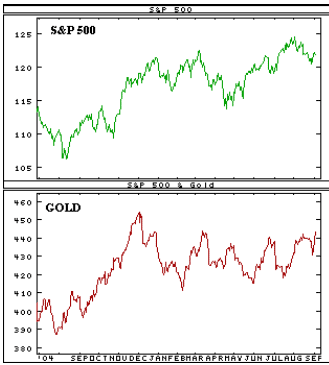
--- correction since December. In the old days, gold used to have almost a perfect inverse relationship to the stock market. If stocks were up on a particular day, gold was almost certain to be down and vice versa. It doesn't work that way anymore. In fact, many old rules don't work anymore, which is why we have to be on constant alert.
Anyway, gold seems to be making a minor breakout at the current time and we remain bullish on this market.
The stock market reaction to the hurricane Katrina was certainly interesting. In the past, big disasters, tend to hit the stock market hard for the first few days and then a significant bottom is found.
For instance, the 9/11 attack closed the market until September 17. Then selling commenced for four days before stocks embarked on a 3 1/2 month rally. Other crises were similar. The Orange County debt debacle. The Long Term Capital Management crisis.
This time around, the stock market didn't even go down for a full session. Shades of the London terrorist attack. One reason may have been that in both cases, the market was oversold and ready to rally. We have found that when the equities markets are ready to go up, news events, even severe ones may retard their progress, but will not derail them.
We can see this in the way the market has reacted to the sharp rise in oil. Crude is up 55% since the first of the year, but the stock market has held its own. The NYSE Composite is up almost 4% during this time.
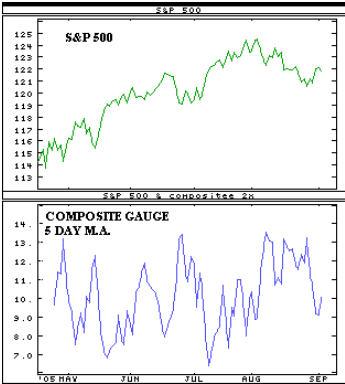
On a bit shorter term basis, the stock market, the chart above is that of the Composite Gauge, which is a summary of various short and intermediate term indicators. It recently became bullish, but we didn't get much out of it. This was probably because oil was pushing things down during the month of August.
That said, history tells us that moves over 13 for this gauge will be bullish for the stock market if we are indeed still in a long term uptrend which we most certainly think that we are. We would expect that, short term, we will move back to the recent highs.
We're seeing a lot of positive things during the weak period of August - September. This probably bodes well for the stock market when the calendar turns more favorable in November.
BONDS AND SENTIMENT
The Bullish Consensus is a survey by Consensus Inc of Kansas City MO. It tallies the sentiment of analysts and newsletter writers and like any crowd, they tend to be wrong at extremes. The second chart below monitors stocks, while the fourth chart monitors the bond market.
The Bullish Consensus for stocks is showing a bit too much bullishness for further progress, but we have to remember that unlike the put call ratio and the Rydex Nova Ursa ratio, this is a survey. Even though it usually works, respondents sometimes have agendas.
Still, the message is somewhat bearish at the present time and we have to factor this into our thinking.
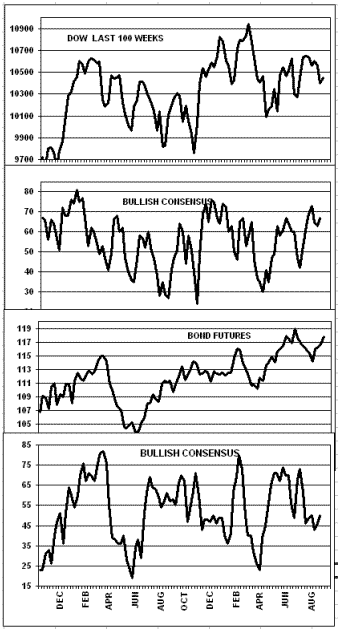
The bond market consensus, on the other hand is mildly bullish at the present time. Not severely so as it was in early April, but it can still support a rally. This is really interesting considering that bonds have actually been in an uptrend while the consensus struggled.
OTHER MARKETS
We are currently bullish on gold. We have been in this posture since August 3 of this year.
We are bullish on the Euro and bearish on the greenback. This has been the case since the close on August 3.
We remain bullish on Treasury Bonds which is where we have been since the close on August 23 of this year.
PUT CALL RATIO
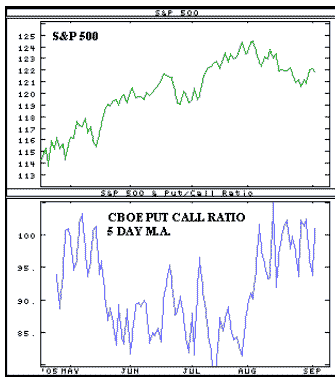
Even though we discuss the CBOE put call ratio in some detail on the first page, it's also instructive on a short term basis.
As the chart shows, the put call ratio has remained fairly high during the latest decline. This probably means that the turn will be vigorous when it comes. Actually, we think that it has already turned and that the next short to intermediate term move will be to the upside.
NEWS AND THE MARKET
(1) On April 7, Crude oil dropped 3%. (2) On April 15, IBM reported poor earnings and there was a slew of poor economic news. (3) On April 21, the Dow rallied 206 points on great
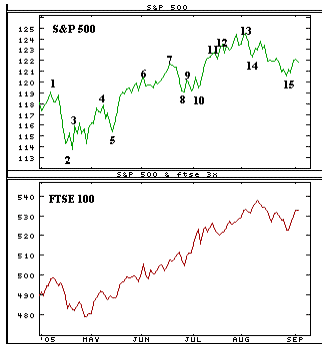
earnings news and solid economic reports. (4) On May 9, the market rallied sharply, most likely in a delayed reaction to the unemployment numbers released the day before. (5) On May 13, the Michigan sentiment numbers were lower than expected and dropped for the fifth month in a row. (6). On June 3rd, the unemployment statistics were much worse than expected and this caused a solid market decline. (7) On June 16, the Dow surged to a new rally high on quadruple witching day. (8) On June 23, the market plunged 166 points after oil hit $60 for the first time. (9) On June 30, the market dropped in disappointment that the Fed again raised rates without hinting when they might end the increases. (10) On July 7, a terrorist attack in London caused some severe early selling, but it came back to close up for the session. (11) On July 14, the PPI (producer prices) came in flat. The expectation was for a rise of 0.4%. (12) On July 20 inventories for crude, distillates and gasoline were considerably better than expected. (13) On August 2 we discussed, in our update, how the news was
good day after day. (14) On August 8, oil surged 2 1/2% to still another record. (15) On August 30 it was apparent that hurricane Katrina was much worse than expected. The Dow was down 110 points in the early going, but came back to cut the losses in half.
THE LONDON MARKET
London stocks continue to fare better than their U.S. counterparts. This is a consistent uptrend.
In fact, much of Europe is faring better the U.S. in the equities department and it's not because they are doing better economically. We discuss this in more detail on the last page of this letter.
NOVA URSA RATIO
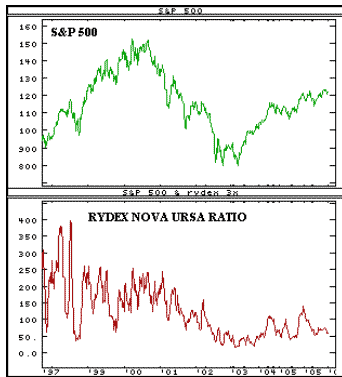
The ratio of Nova (bullish funds) to Ursa (bearish funds) continues to show bearishness and this should be a positive.
Since the bottom in late 2002, the hot money managers who guide investments in this Nova and Ursa funds have been reluctant to commit to the bullish side.
We look at this gauge in much the same way that we do the CBOE put call ratio that we discuss in detail on the first page. It is a contrary indicator of what money managers are actually doing with their money.
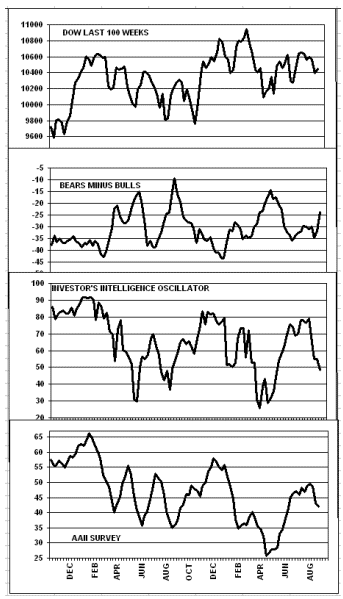
The Dow is making a labored pattern of ascending highs and ascending lows. This is a bullish chart.
Sentiment, as measured by Investor’s Intelligence is basically neutral at the present time .This is a survey.
The Investor’s Intelligence Oscillator, which measures the percentage of NYSE stocks above their own 10 week m.a. is approaching an oversold condition, but it's not there yet.
The American Association of Individual Investors survey is mildly oversold at present. This should be a positive.
The Dow looks to be ending its pattern of descending tops and descending bottoms on the daily chart.
The five day m.a. of five day RSI is curling up from an oversold condition. This is a positive sign.
The Dow advance decline line looks to be firming at the present time, which should be bullish.
The advance decline ratio is curling down from an overbought condition. This is a negative sign.
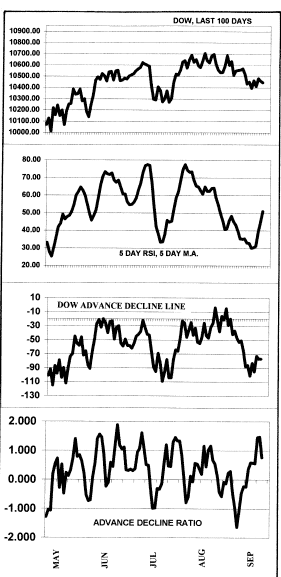
The Dow has retraced about 50% of the recent rally. Frequently, this constitutes a bottom.
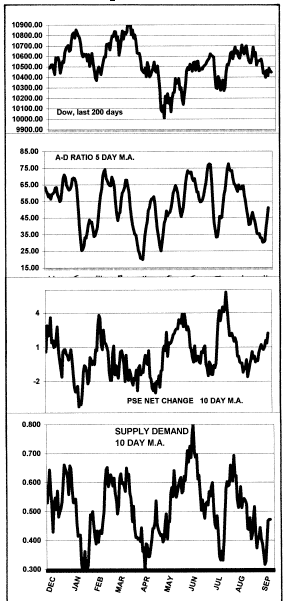
The advance decline ratio is now in a mildly oversold condition and this should be a positive.
The PSE net change 10 day m.a., has turned up from a mildly oversold condition.
The Supply Demand 10 day m.a. is curling up from a very oversold condition and should be a positive.
TRACK RECORD AND OTHER CONSIDERATIONS
On August 8 we bought the SPY at 123.17 and the QQQQ at 39.52. The next day we sold the SPY at 123.35 and the QQQQ at 39.18.
On August we went back into the SPY at 121.25 and into the QQQQ at 38.56 which is where we remain. At the close on Friday, the price of the SPY was 122.26 and the QQQQ was 38.79.
RANDOM THOUGHTS
As you may know, we believe that the stock market and the economy frequently go in opposite directions, both here and abroad. We refer you to a quote from the Wall Street Journal on July 29, " The Dow Jones Stoxx Index of 600 publicly traded European companies rose 9.9% for the first six months, while France's CAC-40 rallied 10.7%. Germany's Xetra-DAX climbed 7.8% and Britain's FTSE-100 stock index rose 6.2%."
"Not bad for a region that with low economic growth, weak domestic demand, high unemployment, bitter political squabbling, rising oil prices …."
We have constantly pointed out the disconnect between the stock market and the economy in this country. This is why we urge subscribers to not listen to economists. First of all they are frequently wrong, but even when they're right, the question is, "So what?". You can't buy 100 shares of GDP. You can't short 600 shares of unemployment rate.
With this in mind, we did hear a rather frightening comment on the economy the other day from an economist named Leo Hindrey. He pointed out that if you subtract the 3 1/2 million security jobs that have been added since 9/11, there have been no new jobs added since then. In other words, the private sector hasn't been doing too well. We can't vouch for Mr. Hindrey's figures, but it is a little scary, given the corporate desire to ship jobs to the Third World.
This disassociation is also valid for earnings.
There are so many times when earnings go up and the stock market sits there and vice versa. Just look at recent history. The Dow has been stuck in neutral since April of 2004 and during this time, earnings have increased by double digits every quarter. In fact, earnings have grown double digits for 13 quarters in a row and the Dow is up something like 2% during that time.
In fairness, we should point out that the smaller caps have done very well during this period. The S&P 400 Midcap is up 33% over the last 13 quarters and the S&P SmallCap 600 is up 95% since its inception in November of 2002 Help may be on the way on the oil front. We understand that there is a heavy demand for hybrid cars that use much less gasoline. This trend should continue.
INTERMEDIATE TERM FUND SWITCHERS
On the following page is our intermediate term timing track record for mutual fund switchers. From Nov 3, 1993 through September 2, 2005, the S&P gained 756 points. Our timing captured 972 points or 121% of the buy and hold. It was enough to rate us # 1 by Timer Digest for the latest 10 year period.
MANAGED ACCOUNTS
In association with Financial Growth Management, accounts are managed by moving between growth mutual funds and money market funds depending on the market outlook.
Contact Ray Hansen at 714 637 7784 for a complete package including track record.


