
GOLD OVER $500 TO A 23 YEAR HIGH!
GOLD has been our most fabulous call since we were ranked #2 Market Timer for the year 2002! Far from our preference, no rating service ranks us on our Gold forecasts.
We traded Gold for a living for the three years before publication began on the Crawford Perspectives newsletter. Maybe rating services think that gives us an unfair advantage?
Our long term LONG position was originated on April 5, 2001 at a price of $258. We raised our stoploss order to $428 and were stopped out there in early 2005.
Expecting a flat to down 6-7 months, we stayed out until our next Long Term BUY date of September 2-6. By then, Gold was breaking out of a huge Triangle pattern which augured in favor of a further advancing leg possibly above $500, at least to 490-500.
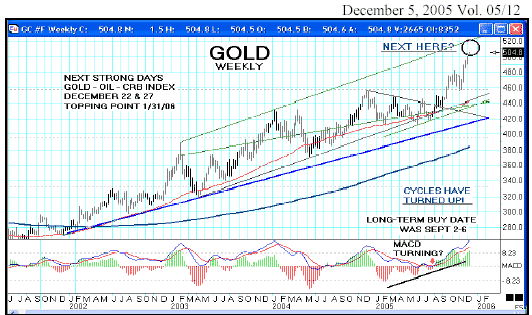
Previous moves tended to be countertrend to the U$ Dollar, but this one was breaking above resistance at previous highs in terms of a number of other currencies, and continued to rise, even in the face of Dollar strength! The world could no longer ignore this proclamation of across the board currency devaluations through the printing of money. Aspects between Jupiter and Neptune are perhaps the strongest in correlation to Inflation and Inflation Hedges; much less important in relation to stock prices. We assumed our initial long term positions on the final Jupiter/Neptune waxing (separating) trine (120 degree separation) of a series. We held through subsequent aspects including the oppositions and quincunxes. Then Gold peaked on the first of a series of Jupiter/Neptune waning trines (240 degree separation, or -120 from the next conjunction). We deducted that the series of 7 trines would leave Gold lower.
Our Long Term BUY of September 2 this year was on the final trine of that series, a last negative hit before a series of positive squares begins in late January, 2006. Studies suggest that the Oil, Metals and overall Commodity Indices will accelerate into these squares during 2006, probably ending sometime during the summer, but possibly as early as the first one in January. From there we will ‘lighten up’ and keep closer, tighter exit stops, and trade more often short term on the Short (down) side of the price movement. These trends more enerally imply a probable attack on the US Dollar by disaffected economic competitors!
“From Nov. 4th to Dec. 2nd, DJIA has climbed …3.3%. If we measure the DJIA in terms of gold… [it] fell 717.82 to 672.22, a -6.4% decline.” Commentary by Jim Turk at http://goldmoney.com
We are very concerned over the Full Moon period around December 15 as multiple outer planet combinations are activated in what must be considered ‘hostile’ contacts. A slew of economic statistics come out that day including CPI and Philly FED Survey.
More dangerous, though, is the Iraqi election. Somebody up there (on our side) has no idea about the astro-energies, or the emotional buildup that manifests at Full Moons, especially hostile ones! Maybe the not so loyal opposition insisted on it, knowing full well the possible outcome?
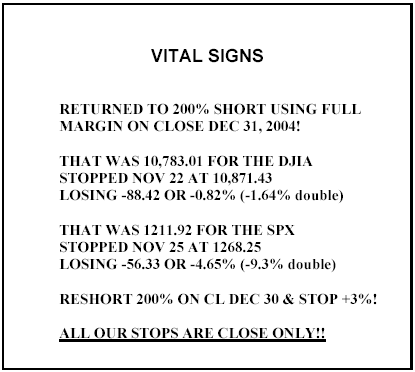
Our Index Positions have been stopped out with results compiled in the VITAL SIGNS box (left). RESHORT 200% ON MKT CLOSE FRI. DEC. 30TH & USE 3% STOPLOSS!
All Major Indices continue forming Long Term TOP patterns, and project forward to Crash potentials late next year.
WISHING YOU THE BEST OF HOLIDAY CHEER!
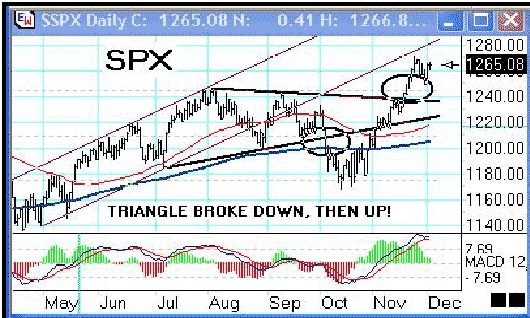
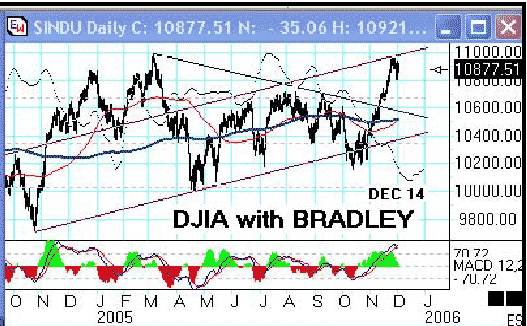
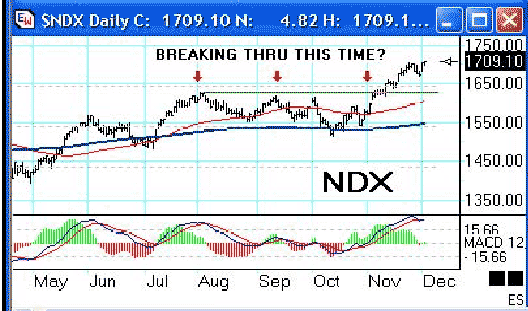
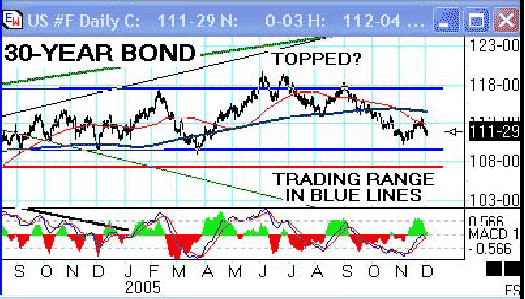
ALL FOUR CHARTS HAVE INITIAL MACD SELL SIGNALS!
Charts pictured above show ($SPX) S&P500 Cash Index, ($INDU) Dow Jones Industrial Average, ($NDX) NASDAQ 100 (not COMPosite), and (US #F) 30-Year T-BOND (price).
All major stock indices continue in process of building Long Term TOP patterns. They all dipped back to break lower support levels around 13 October, and by last month, recovered to resistance points at declining trendlines, and to previous highs. We wrote: “They must turn down immediately, or break out to the upside… So far, markets reverse quickly from bearish breaks, just as the Bradley Model & other astro series begin to accelerate downward.”
In the ‘old days’, downside acceleration into market close would bring high correlation with a ‘Washout” the next morning, a sharp sell-off, approaching ‘panic’ proportions, likely followed by a sharp reversal to the upside from there. In recent many quarters, our markets have not seen enough volatility to establish a technically solid base for the type of rises we have observed. Markets have suffered many devastating news elements, which ‘in former times’ would have inflicted severe damages of -20% to -50%. Terrorist acts, Major Corporate Indictments and Bankruptcies, Tsunamis and Hurricanes, Political hostilities, Negative Consumer Sentiment, Insider Sales, underperforming Employment data, Rising Interest Rates.
Yet, markets walk right past, with glazed eyeballs, obviously sleepwalking or Prozacced out of their minds. Sometimes, greater than normal recoveries are hastened by some Invisible Hand, as gut-wrenching whipsaws seem to appear out of nowhere, and Indexed derivatives and ETF’s soar without rhyme or reason, taking Advance-Decline statistics (and several other measures of internal dynamics) with them as arbitrageurs take advantage of the discrepancies. The ‘Working Group on Markets’ was formed under Reagan, just after the 1987 Fiasco, with the mandate to ‘not let THAT happen again’.
We are of the opinion that they have become so enamored of their own results that they push markets around, almost casually, to benefit their economic and political allies! One important example of this kind of aberration is shown by Alan Newman’s Chart of the Month for December 1 depicting FED Funds changes vs. the S&P500. It is the Exact Reverse of ‘Normal’ with stocks going Down and back Up with Short-term Rates from May 2000 to the present. This is a ‘startling’ and unnatural revelation! What is the market going to do from here? Same as usual, I suppose. The Major Crash and Recession is not due until late 2006 by our own cyclic reckoning. But there are very tough aspects around December 15th, 22nd and 27th. Perhaps a more serious consolidation can form as the New Year begins, as it did early this year. Next year, nations will rise up against us, economically!
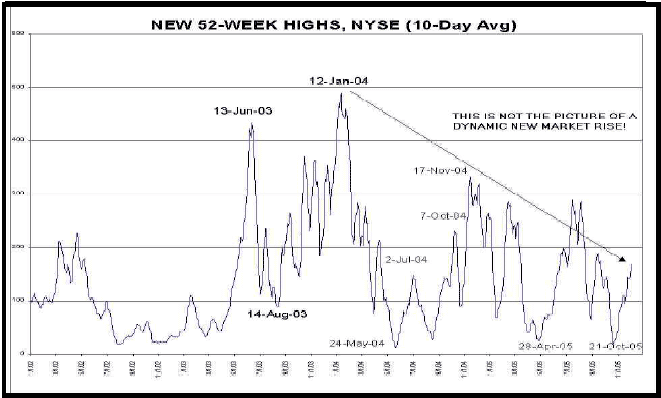
52-WEEK NEW HIGHS OF NYSE STOCKS LAGGING BADLY
The above graph is quite demonstrative of increasing internal weakness, despite continuing advance in Price Indices! In addition, New Highs/New Highs+New Lows, shown last month, has rapidly recovered near the .70 level. If it continues up another day or two, and betters the .70 threshold, any turn back down will render a SELL on this indicator.
Joe Granville’s 10-Day CLIMAX Sum made an unusually rapid rise to much overbought heights and has turned back down, breaking first levels of support. Sometimes there is one more pop of a few days (but not to month end). It will be difficult for this indicator to maintain recent lofty advances. Perhaps our markets could dip into the Bradley Model lows around the 14-15 of the month, and attempt another launch after the Solstice (22nd).
Joe writes: “…the number of OBV higher ups. Unknown to most, stood at a blow-off high of 13 on Nov. 22nd. From there, it quickly collapsed to zero on Nov. 30th. It then rose to +2 on Dec. 1st, the day the Dow rose 106.70 points. There was the superb technical proof that the decline in that number had sealed the fate of the Dow… The Santa Claus rally had undoubtedly come early this year. It was all over last Friday.” - Granville Market Letter (1-800-876-5388)
Peter Eliades of Stockmarket Cycles (1-800-888-4351) says: “The psychological background appears to be almost perfect for the formation of a major top. Investor and adviser bullishness in unprecedented in its longevity when compared with prior long streaks of bullishness in the history of Investors Intelligence data going back over 40 years. The market is just weeks away from completing its third consecutive year without one weekly reading showing a plurality of bears over bulls.”
Jim Tillman of Cycletrend (email JET@CYCLETREND.NET) states: “The stock market is in the final throes of completing an important topping pattern leading to a bearish 2006. Internal erosion continues as evidenced by the year long downtrend difference in new highs vs. new lows which is consistent with this type of topping process as a wedging pattern nears completion… Based on past examples [along with TRIN or ARMS index] we believe these are ingredients for making a cycle / market high and would be selling into strength.
Alan Newman headlines in CROSSCURRENTS (516-557-7171): “Massive Insider Selling Continues” and continues: “As NASDAQ kicks up repeatedly to new highs for the year, insiders continue to aggressively sell their holdings… close to 2000 shares were sold for each share purchased.”
So many different measures are now at or past reasonable extremes, and stretching to historic extremes. Not a good bet!
The station of Mars on Dec. 9, taken alone, would tend to take GOLD down for about 3 days, into that event. We would SHORT NOW, and COVER and GO LONG near the Close on Friday, Dec. 9 or on Open on Monday, Dec. 12. Our preference would be actually on the th, or to split the ticket, half & half.
The extreme case of multiple harmonics to the Full Moon on the 15th may magnify effects on the Inflation Hedge commodities to a short term Maximum at that time, although we
expect higher on the 22nd and 27th with further gains into late January.
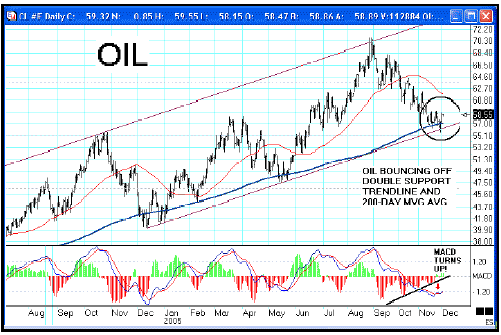
The OIL chart above shows the price encountering support at the lower channel line which is coincident with the 200-Day Moving Average. Strategy would dictate a BUY here or in the near future, preferably in the 55-57 range, and also by the open on the 12th at latest. Longer term charts on the OIL Complex are remarkable for the steadiness of the gaining trends, and forecast much higher prices in the not too distant future. “Yet, there is ample evidence that still higher realms will be targeted as the series of Jupiter/Neptune squares begins to unfold from January, 2006!” We feel confident that the Long Term movement from financial to commodity assets will continue for several more years, although we expect significantly higher highs across a wide front between Jan. 28 and Sept. We NO LONGER recommend the Stocks, but continue to like the BONDS and Currencies of Australia, New ealand, Canada, and to a lesser extent Russia and South Africa (greater political risk). We have been LONG for the last 4 years, along with GOLD, from April 5, 2001. (We were stopped out of our Gold position in January, after raising the Stop to $428 last December. From whatever low is final, here, a spectacular run could carry Inflation Hedges and multiple commodities much higher. The page 1 chart (shown for months) had the next long term buy on GOLD as September 2-6!
ASTRONOMIC ACTIVITY
DEC 1 = New Moon forms a Grand Trine with Saturn & Node. Mars opposite Jupiter forms a T-square with Saturn. Too much Saturn.
DEC 3-4 = Mercury returns to Direct motion & hits Neptune twice! = Careful of alcohol, drugs, confusion, deception on weekend.
DEC 7 = Jupiter semi-square (45 deg) Pluto = One meaning is “The misfortune to lose everything.” (Ebertin) Bankruptcy.
DEC 9 = Mars returns to Direct motion = Action begins to return to forgotten or lagging projects. Maybe year-end rally begins!
DEC 14-15 = Indicated Market Low by the Bradley Astronomic Model for a rally into January. Has NOT called the current rally!
DEC 15-18 = A difficult period for strong negative aspects, esp. the 15th as the Full Moon activates Pluto/Hades opposition and
the Jupiter/ Saturn square by the 45 and 135 half aspects. Gives directed driving force, but may prove callous, overriding.
TRY NOT TO TRAVEL ON SUNDAY, DEC 18TH! Traffic may be re-routed unexpectedly. Weather or computer problems.
DEC 21 = Winter Solstice = Darkest night. Everyone turns on their colorful lights to coax the Sun to return north–It works Every Time!
DEC 22 = Mars contra-parallel Pluto = Coercion, violence. Sun 45 to Neptune = Metals, Oil, CRB Index to the Moon, Alice!
DEC 24-25 = Venus Stations Retrograde = Softer side of life fades. Christmas Eve nice, but Christmas day difficult, testy.
DEC 27 (Tue) & 31st (Sat) are very difficult with mostly sedative, depressive or dour aspects involving Saturn. No Santa Claus rally?
DEC 30 = New (Blue) Moon involves close aspects to 7 of 10 principal sky bodies. Complex, powerful, energetic. Good & Bad.
JAN 1 = Sunday brings hangovers from Mercury 135 to Mars and Saturn 135 to Pluto. We hear of bankruptcies from Katrina!
Next 10 days mixed and quieter. Then more positive on Friday the 13th!
JAN 14-15 = The Full Moon weekend brings a chill to relationships, private or professional. Hostile takeovers, abrupt breaks.


