Timer Digest" Tim Ord ranked #5 for one year ending 6/3/05 and #1 in Gold for one year ending 1/13/06.
For 30 to 90 days horizon: Short SPX on 1/20/06 at 1261.49. Short Nasdaq on 2/17/06 at 2282.36.
Monitoring purposes XAU: Long XAU, 129.56 on 12/29/05.
Longer Term Trend monitoring purposes: Short SPX On 3/21/06 at 1297.23.
We have "800" phone update that cost $2.00 a min. and billed to a credit card. Call (1-970-224-3981) for sign up. We update Eastern time at 9:45; 3:15 and 4:00. Question? Call me (402) 486-0362.
What to expect now.
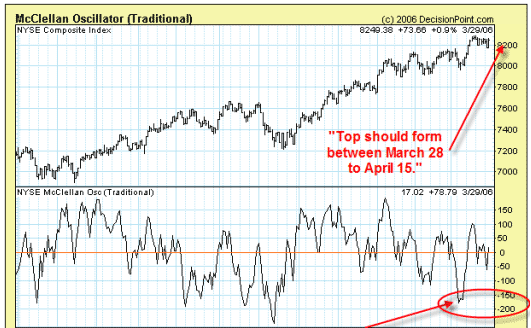
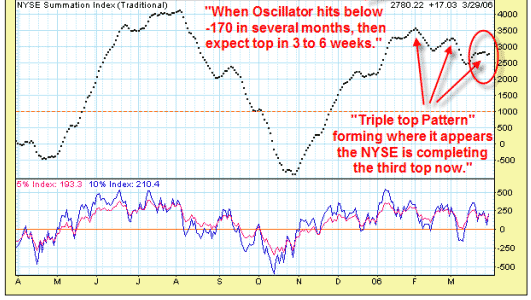
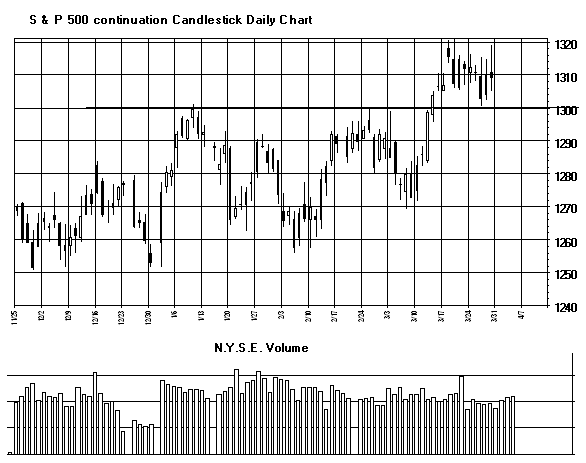
Displayed below is the daily NYSE chart, with its McClellan Oscillator and Summation indexes (Courtesy of www.decisionpoint.com). According to Tom and Sherman McClellan book, “Understanding Oscillators and other Indicators”, when the McClellan Oscillator trades below -170 in several months, it implies a “Shot over the Bow” and warning that a top is approaching. Normally time frame a top can be expected when the -170 Oscillator reading is recorded is 3 to 6 weeks. A -178 Oscillator reading was recorded on March 7 and 3 to 6 weeks out would imply a top should from between March 28 to April 15. Also another bearish pattern is developing on the Summation index called a “Triple Top Pattern”. This pattern predicts the topping process is complete when the “Third Top” on the Summation index is finished. It appears the third top is being completed now. Therefore the Oscillator is warning that a top is nearing and the Summation index is completing a bearish pattern. We are short SPX .
NASDAQ Market:
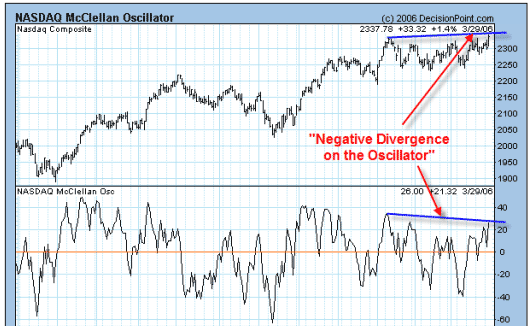
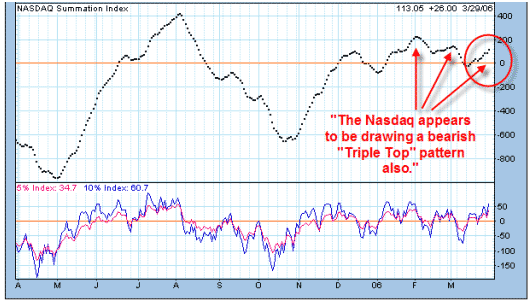
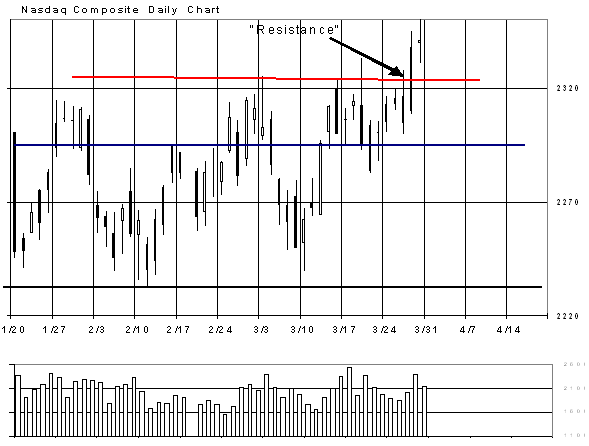
Below we have displayed the daily Nasdaq chart with its McClellan Oscillator and Summation index (Courtesy of www.decisionpoint.com). For the Nasdaq we are a little nervous about our position. It does appear the Nasdaq is having trouble rally here and the Oscillator is showing a negative divergence. The Summation index may also be drawing a “Triple Top” pattern and a bearish formation. However, The Summation index has not turned down yet. Today on the Daily chart the Nasdaq traded above yesterday’s high on lighter volume and then closed below it triggering a short term bearish sign. Tomorrow ends the month of trading for March along with the weekly, and we will see how the how the end of week and month close out tomorrow. We are short the NASDAQ at 2282.36 on 2/17/06.”
GOLD Market:
"Timer Digest" has ranked Tim Ord as the #1 gold timer for one year ending 1/13/06.
Short term trade, Long BGO (4/19/05) at 2.37. This trade is separate from our long-term position in BGO. We bought EGO (gold Issue) at 2.23 (5/26/05) Sold 10/20 at 2.92 for 31% gain. We bought PMU (5/27/05) at .50 and bring our average price to .81. Long TRE at 2.55 on 11/1/05, sold at 3.39 on 12/3/05 for 33% gain. Long NG at 8.47 on 11/2/05. Sold NG on 11/30 at 9.20 for gain of 9%. Long DROOY at 1.27 on 11/9/05, Sold 1/19/06 at 1.89 for 49% gain. Long AGT at .33 on 2/1/06. Long TRE at 6.84 on 3/6/06. We bought TGB at 1.84 on 3/27 by intraday email report.
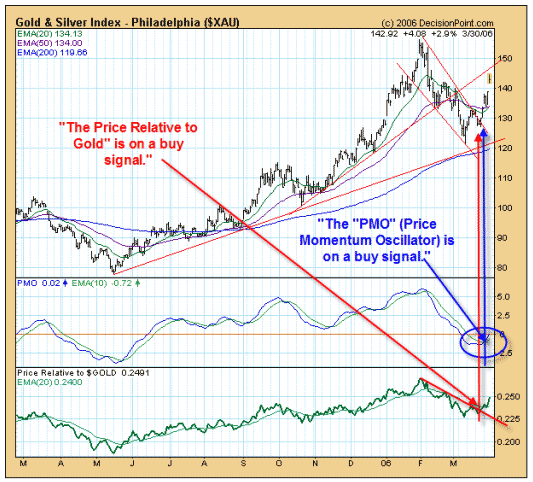
We showed on previous reports that the “Cumulative Net Cash Flow” on the Rydex Precious Metals fund was in an area was previous short term lows have occurred in the past. The minimum duration of the rally that followed these events were two months. Therefore, the XAU may rally into the May time frame. Below is the XAU with its “Price Relative to Gold” ratio. Notice that the “Price Relative to Gold” has crossover the red downtrend line draw down from the February high and has generated a buy signal by this method. Also notice that the daily “PMO” (Price Momentum Oscillator) also has had a bullish crossover and has generated a buy signal by this method. The XAU should head higher near term and possibly rally into the May time frame. There is a possibility that the next higher degree impulse wave has started and the XAU could rally into late this year to early next year and hit our 200 target on the XAU. More on this later.
We doubled our positions in BGO on (7/30/04) at 2.34 and we now have an average price at 2.70. Long CBJ for an average of price of 2.75. Long NXG average of 2.26. We bought PMU (5/27/05) at .50 and bring our average price to .81.
For examples in how "Ord-Volume" works, visit www.ord-oracle.com.
