"Timer Digest" has Tim Ord ranked #5 for one year ending 6/3/05 and #1 in Gold for one year ending 1/13/06.
For 30 to 90 days horizon: Short SPX on 1/20/06 at 1261.49. Short Nasdaq on 2/17/06 at 2282.36.
Monitoring purposes XAU: Long XAU, 129.56 on 12/29/05.
Longer Term Trend monitoring purposes: Short SPX On 3/21/06 at 1297.23.
We have "800" phone update that cost $2.00 a min. and billed to a credit card. Call (1-970-224-3981) for sign up. We update Eastern time at 9:45; 3:15 and 4:00. Question? Call me (402) 486-0362.
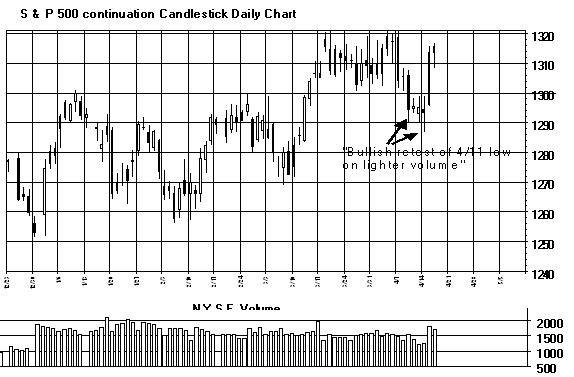
What to expect now:
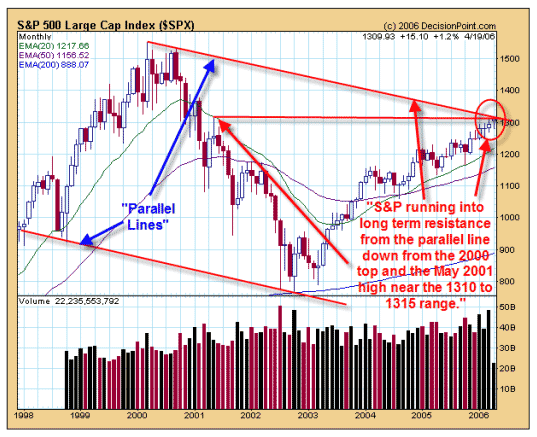
The longer term monthly SPX chart dating back to 1998 is displayed below (Courtesy of www.decisionpoint.com). We have shown this chart in the past and is worth showing again. We have drawn a line from the 1998 low to the 2002 low and drew a parallel line off of the 2000 high. The parallel line off of the 2000 high comes in near the 1310-1315 range, which is where the SPX is now and is a resistance zone. I also have drawn a line off of the May 2001 high and that comes in at the 1310 to 1315 range also and is also resistance. Therefore there is double resistance at the 1310 to 1315 range and is a likely place for the SPX to stop and reverse. The McClellan Oscillator and Summation index are also showing bearish developments. Yesterday’s and today’s rally, in our view is nothing other then a “Short Squeeze” rally which are short lived and are typically seen in bear market rallies. In “Richard Wycloff” Terms, it would be a “Buying Climax” which comes at the end of a move. First significant support on the NYSE comes in near the 7650 range, which equates to 1240 range on the SPX. We don’t think those range will hold and the market will head down to the next area of support near the October 2005 lows near the 1175 range on the SPX and 7200 range on the NYSE. The “Four year cycle” low is due in October 2006 and is where the final lows may be made on these markets. We are short SPX on 1/20/06 at 1261.49.
Bought Ivan (Invanhoe Energy) 4/13/06 at 2.55. Energy stock. Could go to Gap area (November 2003) near 5.40. We Bought ASTM at 1.92 on April 3. Biotech group.
To learn more on "Ord-Volume" visit www.ord-oracle.com.
Nasdaq Composite:
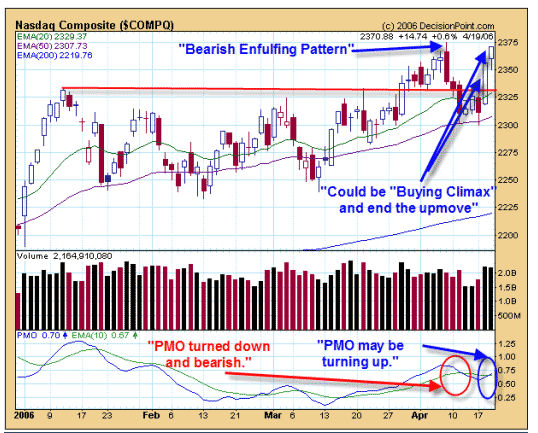
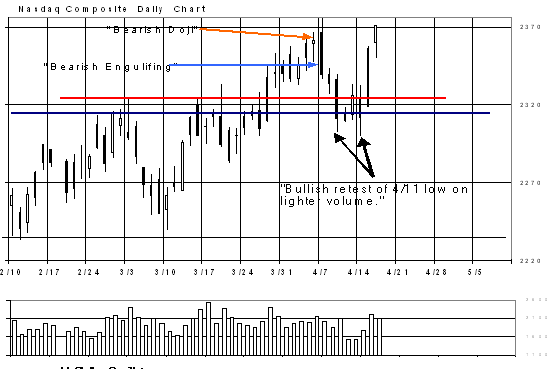
Displayed below is the Nasdaq daily. On April 7 a bearish candlestick pattern formed called “Engulfing pattern”. The Nasdaq fell for three days creating another bearish candlestick pattern called “Three Black Crows” and is bearish intermediate term signal. Over the last couple of days the Nasdaq rallied strongly. We think the current rally may be a “Buy Climax” which comes at the end of a rally phase. These strong rally phase usually blow themselves out quickly. There are plenty of negative divergences on the McClellan Oscillator and Summation index to suggest a top here and the SPX is at long term resistance which usually parallels the Nasdaq. May is usually the second worst performing month of the year right behind October. We are expecting the final lows to show up in October 2006 which is when the “Four Year Cycle Low” is due. We are short the Nasdaq 2282.36.
"Timer Digest" has ranked Tim Ord as the #1 gold for one year ending 1/13/06.
Gold Market:
Short term trade, Long BGO (4/19/05) at 2.37. This trade is separate from our long-term position in BGO. We bought EGO (gold Issue) at 2.23 (5/26/05). Sold 10/20 at 2.92 for 31% gain. We bought PMU (5/27/05) at .50 and bring our average price to .81. Long TRE at 2.55 on 11/1/05, sold at 3.39 on 12/3/05 for 33% gain. Long NG at 8.47 on 11/2/05, Sold at 9.20 on 11/30/05 gain of 9%. Long DROOY at 1.27 on 11/9/05, sold at 1.89 on 1/19/06 for 49% gain. Bought AGT at .33 on 2/1/06. Long TRE at 6.84 on 3/6/06.
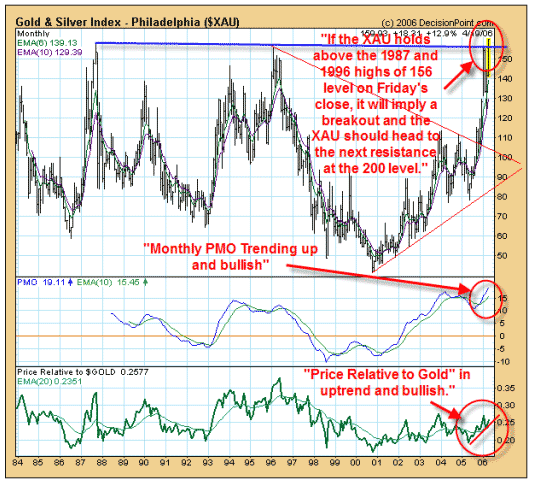
Below is the “XAU” (Courtesy of www.decisionpoint.com). If the XAU holds above the 1987 and 1996 highs of the 156 range on Friday’s close, it will imply a breakout and the XAU should head to the next higher resistance area at the 200 level. The Monthly PMO is trending up and implies the monthly momentum is up. The “Price Relative to Gold” remains on an uptrend from the May 2005 low and is bullish. Our upside longer term target is still the 200 range on the XAU. We are watching EGO, GRZ and VGZ (gold Issues) for possible buys on any pullback to support.
We bought TGB at 1.84 on 3/27 by intraday email report. We bought TRE on 3/6 at 6.84 by intraday email report.
We double our positions in BGO on (7/30/04) at 2.34 and we now have an average price at 2.70. Long CBJ for an average of price of 2.75- sold 4/10/06 at 3.72 for 35% gain. Long NXG average of 2.26. We bought PMU (5/27/05) at .50 and bring our average price to .81.
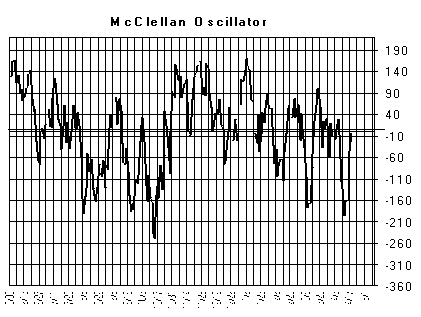
The McClellan Oscillator closed today's at "-5" and neutral.
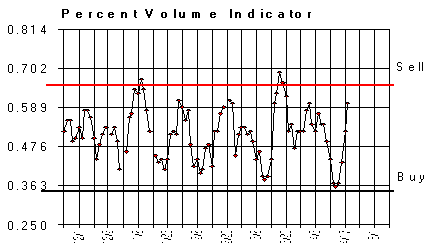
The “Percent Volume” Indicator closed .60 and bearish short term.
The "5 day ARMS" closed today at 4.04 and short term neutral.
Conclusion: Short SPX at 1261.49 on 1/20/06, Short Nasdaq on 2/17/06 at 2282.36.
Longer Term Trend monitoring purposes: Short SPX On 3/21/06 at 1297.23.
