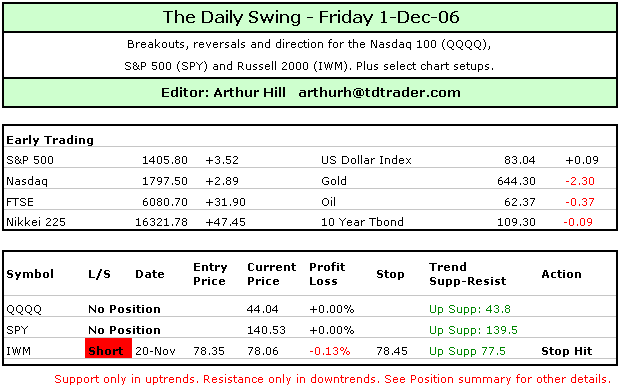
***Position Summary***
The medium-term trends remain up and the short-term trends are up as the major index ETFs bounced over the last three days. Despite these short-term uptrends, I see rising wedges on the QQQQ and IWM charts (60 minute). SPY managed to make it all the way back to last week’s high. In contrast, QQQQ and IWM remain below last week’s highs. Small-caps and techs are not keeping up with large-caps this week and this shows a bit of relative weakness in two key areas of the market. Nevertheless, these wedges are rising and Wednesday’s gaps are holding. While I am not impressed with the breadth or volume behind this advance, I must respect the bulls as long as these wedges rise. A move below wedge support, which is marked on the 60 minute charts, would reverse the three day uptrends and signal a continuation of Monday’s decline. My short position in IWM was stopped out for a small loss. I am focusing on these wedges for my next signal and will return to my shorts if IWM hits 77.4, QQQQ hits 43.75 and SPY hits 139.4. Should these positions trigger, I will set stops 10 cents just above yesterday’s highs.
***Previous Day***
Stocks were mixed on Thursday. The Nasdaq and Dow lost ground, while the S&P 500 and Russell 2000 gained ground. Small-caps led the way higher for the third day running. Overall, it was a day of consolidation as a number of doji and small candlesticks formed. Volume surged on the NYSE Composite and edged higher on the Nasdaq. Expanding volume and indecisive trading often foreshadow a reversal.
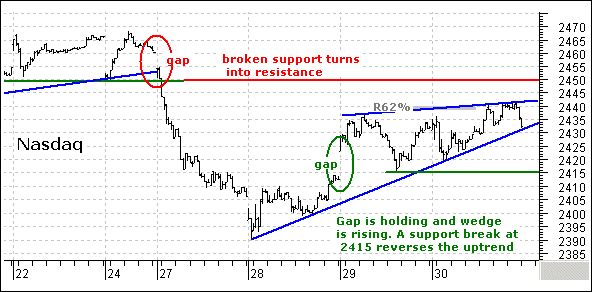
The Nasdaq chart captures the three day advance as a rising wedge. The gap is holding and the wedge is rising to keep the uptrend in place. However, the index has not moved much since the Wednesday morning gap. The index is near resistance from the 62% retracement mark and broken support at 2450. Look for a break below 2415 to signal a continuation of Monday’s decline and project further weakness below Monday’s low.
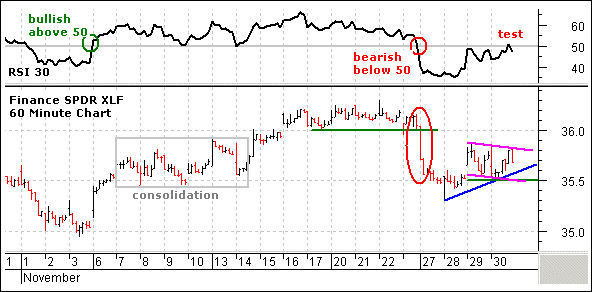
Six of the nine sectors gained on the day with Energy and Utilities leading the way higher – again. The Consumer Staples, Finance and Industrial sectors were weak and closed lower. The moves were all rather small and insignificant. My eyes are on the Finance SPDR (XLF), which represents the biggest sector in the S&P 500. The ETF plummeted on Monday, gapped higher on Wednesday and then consolidated the last two days. A break above 35.9 would signal a continuation of Wednesday’s surge and be bullish. A break below 35.5 would signal a continuation of Monday’s decline and be bearish for the ETF and the market overall.
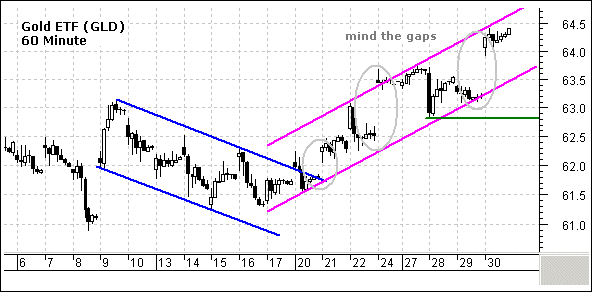
Bonds, gold and oil were up on Thursday and the US Dollar Index fell. I find it a bit strange that bonds are rallying with gold and oil. Actually, oil is not that strong and gold may be benefiting from weakness in the greenback. It makes sense that the US Dollar Index is falling at the expense of strong oil and gold. The StreetTracks Gold ETF (GLD) gapped higher at least three times in the last few weeks and remains in a strong uptrend. I pointed out the breakout at 60 in early November and gold is not looking back. The move is only as strong as the last gap. A rising price channel is taking shape and the gap is bullish as long as it holds. Look for a move below 62.8 to reverse this short-term uptrend in gold.
***Nasdaq 100 ETF (QQQQ)***
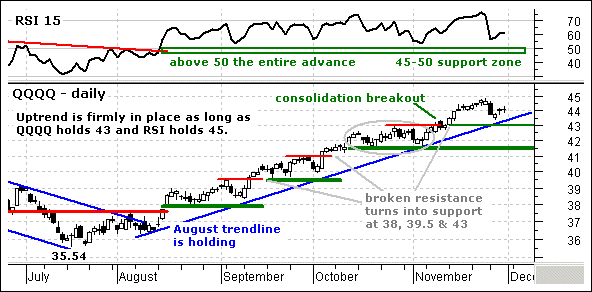
QQQQ stalled for two days with two doji and there is no change on the daily chart. The consolidation breakout at 43 affirmed the uptrend and broken resistance turns into support at 43. RSI has held above 50 the entire advance and momentum remains bullish. The medium-term uptrend is firmly in place as long as QQQQ holds 43 and RSI holds above 45.
 gifs/d1201_qqqq_i.gif
I am not impressed with the rally over the last three days, but it is a rally and has yet to reverse. QQQQ broke down on Monday with gap and sharp decline. The three day rising wedge retraced around 62% of that decline and is meeting resistance from the broken support zone (44-44.3). RSI also broke below 50 and bounced back over the last few days. RSI is meeting resistance around 50 and we are at the moment-of-truth. As long as the wedge rises, we should respect the advance and give the bulls the benefit of the doubt, especially since the medium-term trend is up. A break below 45 in RSI and 43.75 in QQQQ would reverse the three day advance and call for a continuation of Monday’s decline. The initial downside target would be 43 and the wedge high would become resistance.
***S&P 500 ETF (SPY)***
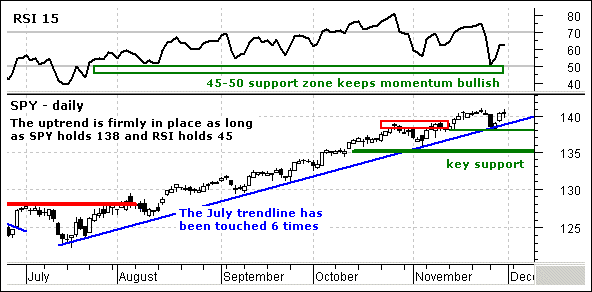
SPY formed an indecisive doji near resistance and there is no change on the daily chart. The July trendline and broken resistance converge to establish support around 138 and RSI bounced off support at 50. The medium-term uptrend is firmly in place as long as RSI holds above 50 and SPY holds above 138.
 gifs/d1201_spy_i.gif
SPY broke support on Monday and moved back above the support break early Wednesday with gap. The gap and surge above 140 were enough to revive the bull and the ETF is challenging resistance around 141. SPY is stronger than QQQQ and I will respect the bulls as long as this upswing holds. It is possible to draw a trendline extending up from Tuesday’s low. A move below this trendline and Wednesday’s low (139.5) would reverse the current upswing and call for at least a support test around 138. RSI moved back above 50 to return momentum to the bulls. Look for a move below 45 to turn momentum bearish and conform a support break at 139.5.
***Russell 2000 iShares (IWM)***
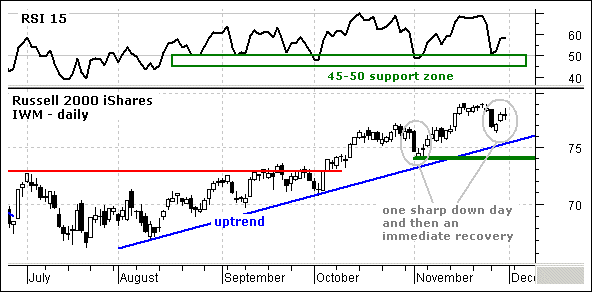
IWM formed a doji to signal indecision on Thursday and there is no change on the daily chart. Small-caps led the way over the last two days and the four day pattern looks similar to early November (gray ovals). There was a one day sharp decline, a day of firmness and then the start of an extended recovery. Shorts need to be careful in here. The medium-term uptrend is firmly in place as long as IWM holds key support at 74 and RSI holds above 45.
 gifs/d1201_iwm_i.gif
IWM gapped down and broke support on Monday, but quickly recovered over the last two days and is challenging this support break. RSI broke below 50 on Monday and then moved right back above 50 early Wednesday. Even though the bulls have the edge again, the advance looks like a rising wedge and RSI is barely above 50. A rising wedge is bearish, but only until confirmed with a support break. Look for IWM to break 77.5 and RSI to break 45 to reverse this advance and signal a continuation of Monday’s decline. The initial downside target would be to around 75.5 and the wedge high would become resistance.
***Stock Setups***
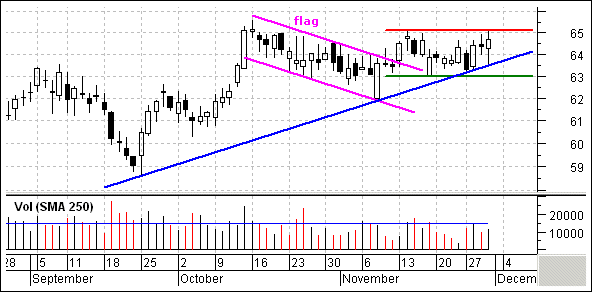
Weyerhaeuser (WY) broke flag resistance in mid November and continues to show signs of strength. The stock basically consolidated the last two weeks with support at 63 and resistance at 65.1. I am looking for a break of this range for the next signal. A move to 65.2 would be bullish and target a move to 70. A move below 63 would negate the flag breakout and be bearish.
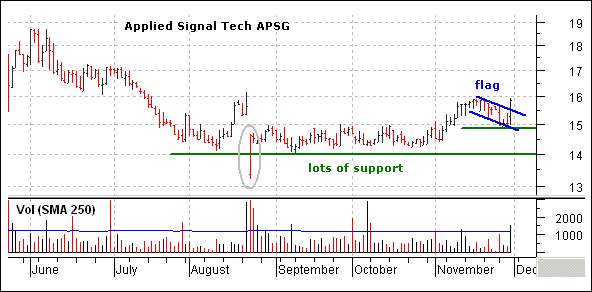
Applied Signal Tech (APSG) is a small-cap defense contractor that popped on good volume Thursday. The stock took a hit in August after an earnings and revenue miss (gray oval). However, the stock closed near the high of the day and firmed the next few months. There is lot of support at 14 and the stock moved higher in early November. After a flag correction the last two weeks, the stock broke resistance with high volume. I find this breakout bullish and would expect a move towards 18-19 resistance. The move reinforces support at 14.8 and a move below this level would negate the bullish signal.
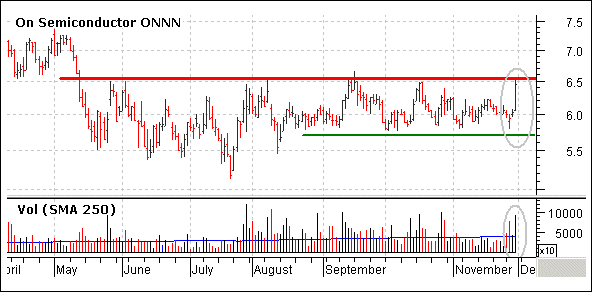
On Semiconductor (ONNN) surged off support at 5.7 yesterday and is on the verge of a resistance breakout. Notice that upside volume was strong in September and October. In addition, upside volume surged yesterday and I expect a breakout. This is another low priced stock with above average risk – small positions and a close watch are required. There is no choice but to set key support at 5.7 and a break below this level would negate yesterday’s bullish surge.
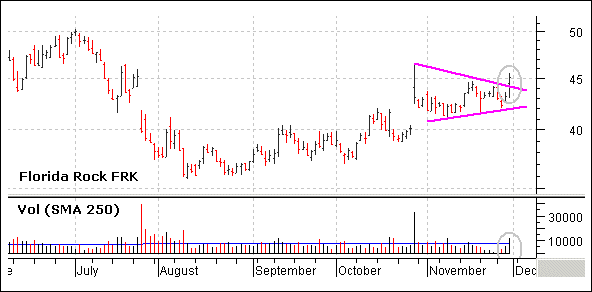
Florida Rock (FRK) is a play on the building materials rebound (housing). The stock worked its way higher from August to mid October and then surged in late October with a gap. FRK then consolidated with a triangle and broke triangle resistance with good volume yesterday. The breakout is bullish and targets a move to around 50. A break back below 43 would negate this bullish signal.
***Breadth***
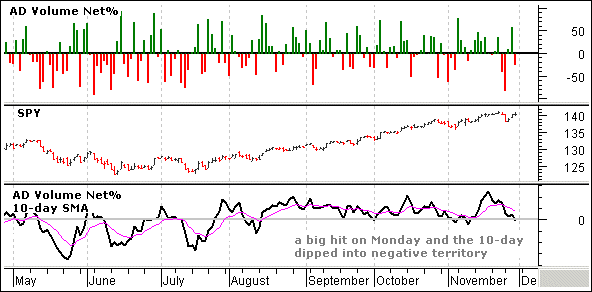
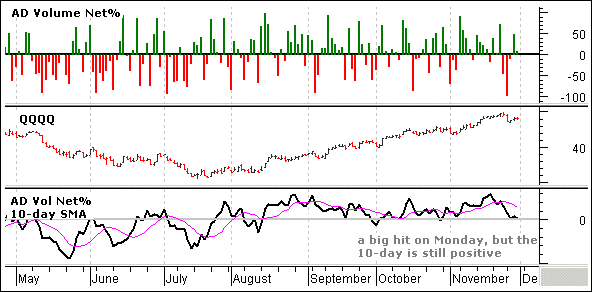
AD Volume Net% finished negative for SPY and positive for QQQQ. SPY’s 10-day SMA for AD Volume Net% turned negative and Monday’s sell-off is taking its toll. QQQQ’s 10-day SMA for AD Volume Net% remains in positive territory and I am not quite ready to turn bearish on short-term breadth. However, it would not take much more weakness to push both into negative territory and this would be bearish for breadth.
Good day and good trading -Arthur Hill
---------------------------------------------------------------
Click here to post a comment, suggestion or question.
---------------------------------------------------------------
Disclaimer: Arthur Hill is not a registered investment advisor. The analysis presented is not a solicitation to buy, avoid, sell or sell short any security. Anyone using this analysis does so at his or her own risk. Arthur Hill and TD Trader assume no liability for the use of this analysis. There is no guarantee that the facts are accurate or that the analysis presented will be correct. Past performance does not guarantee future performance. Arthur Hill may have positions in the securities analyzed and these may have been taken before or after the analysis was present.
--------------------------------------------------------
about: The Daily Swing is posted every trading day around 6AM ET and focuses on short-term trends and price patterns. These can be as short as a few days or as long as a few weeks.
--------------------------------------------------------
Sources: Data from Bloomberg.com, CBOT.com, Kitco.com and ino.com; Charting from Metastock (equis.com). Closing data from Reuters.com, eSignal.com, MS QuoteCenter and Yahoo! Finance.


