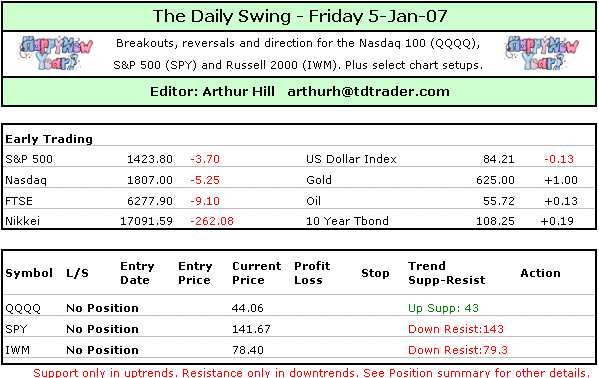
***Position Summary***
The fireworks are already starting in2007 – but not for everyone. Techs stocks led the market higher onThursday and this is generally positive overall. However, I amconcerned with relative weakness in the S&P 500 and Russell 2000.In addition, SPY and QQQQ breadth remains bearish. This is looking likea seesaw market where a few sectors go up at the expense of others.This will make it difficult to trade the broad index ETFs like SPY, IWMand DIA. The action is going to be with the sector and industry groupETFs. The medium-term trends remain up as key support levels areholding. QQQQ, SPY and IWM have been in trading ranges the last 4-6weeks. QQQQ got a strong bounce off range support, but the bounces inIWM and SPY were rather lackluster yesterday. QQQQ is in a short-termuptrend. IWM and SPY have yet to fully recover from Wednesday’sreversal and remain in short-term downtrends. The short-term trends aremixed and this makes for a tricky trading environment. Perhaps the dustwill clear next week.
***Previous Day***
Stocks rebounded on Thursday with bigtechs leading the way higher. The Nasdaq 100 gained 1.91% and theNasdaq advanced 1.21%. That is quite a big difference and shows apreference for large-caps over more speculative issues. The NYSEComposite was lower and the other indices finished with small gains.NYSE and Nasdaq volume was above average. This is good for the Nasdaq,which surged, and a non-issue with the NYSE Composite.
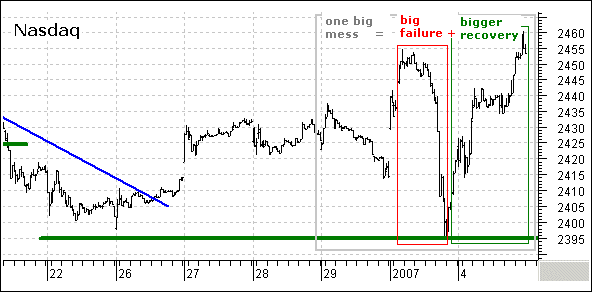
The Nasdaq is one big mess and it allstarted on 29-Dec when the Nasdaq opened strong and closed weak. Thiswas followed by gap and big surge the first 90 minutes of 2007 and thena big failure. However, this big failure was greeted with an evenbigger recovery. In the last two days the Nasdaq has been up 40, down60 and up 65. It is a mess, but the bulls now have the edge with thebigger recovery and move above the 3-Jan high.
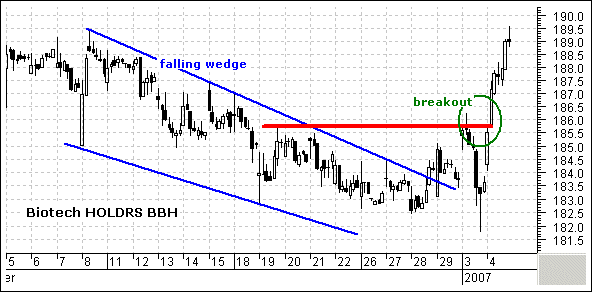
The sectors were mixed with five up andfour down. Energy and Materials led the way lower, while Technology andHealthCare led the way higher. I am impressed with recent strength inHealthCare, especially with the Democrats taking control of congress.The Biotech HOLDRS (BBH) led the way higher with a surge aboveresistance on big volume.
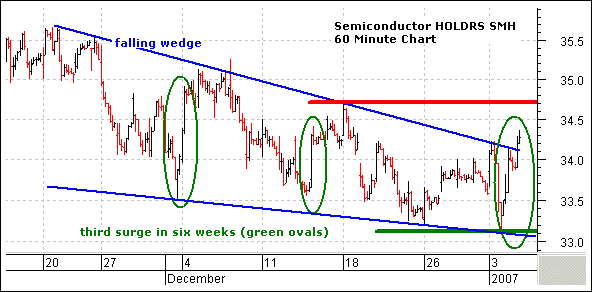
All five tech groups surged (networking,internet, software, semiconductors and biotech). I am impressed withthe Semiconductor HOLDRS (SMH) and its third surge off support. Yes,this is the third breakout attempt in the last six weeks. “Attempt” isthe key word. The first two failed and the third one needs to clear34.75 to forge a higher high. At the very least, this solidifiessupport at 33 and a break below this level would be bearish for semisand this would weigh on the Nasdaq.
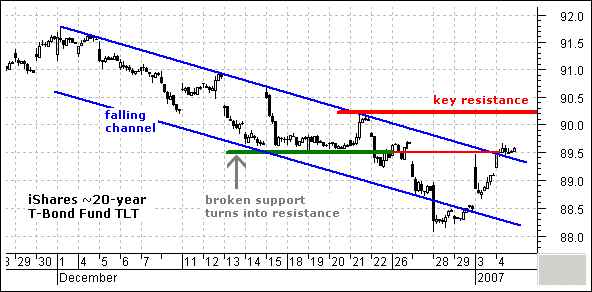
The U.S. Oil Fund ETF (USO) fell below$48 and the StreetTracks Gold ETF (GLD) dipped below $62. Fallingcommodity prices lifted the US Dollar Index and the Euro Currency Trust(FXE) gapped down. Bonds were also strong as the iShares ~20-yearT-Bond Fund (TLT) gapped up and closed above 89.5. TLT is not quite outof the woods just yet. The recovery over the last four days returned tobroken support and there is now a lot of resistance around 89.5-90. Iwould like to see a move to 90.3 to fully reverse the 4-5 weekdowntrend.
***Nasdaq 100 ETF (QQQQ)***
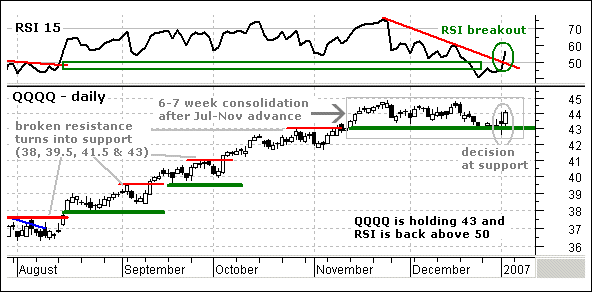
QQQQ surged off support at 43 and thisreinforces support here. More importantly, it keeps the medium-termuptrend alive and techs are still in the ball game. The Jul-Nov advanceestablished the uptrend and the consolidation over the last 6-7 weeksis just a rest as long as key support at 43 holds. RSI is back above 50and momentum is bullish again.
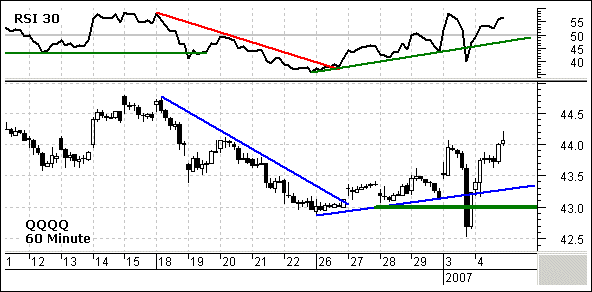
On the 60 minute chart, I am just goingto ignore the Wednesday afternoon plunge below 43 and draw a trendlineright through it. Except for this plunge/reversal, QQQQ and RSI havebeen working their way higher since 26-Dec. As long as QQQQ holds above43 and RSI holds above 45, I will treat the short-term trend as bullishand expect higher prices. The next resistance zone is around 45 fromthe Nov-Dec highs.
QQQQ has been range bound since midNovember and the short-term trend (within this range) is now up. Aftera big volatile battle, trading range support at 43 held and the bullshave the edge. I still find trading too volatile right now and willwait until next week before considering any directional bets.
***S&P 500 ETF (SPY)***
No change: SPY stalled yesterday and hasgone nowhere since early December. Momentum peaked in late October andRSI has a series of lower highs working. This momentum indicatorremains above the 45-50 support zone though. I am raising key supporton SPY to 140. A move below this level would break the August trendlineand December lows. This would also push RSI below 45 and I think wewould then see a correction unfold.
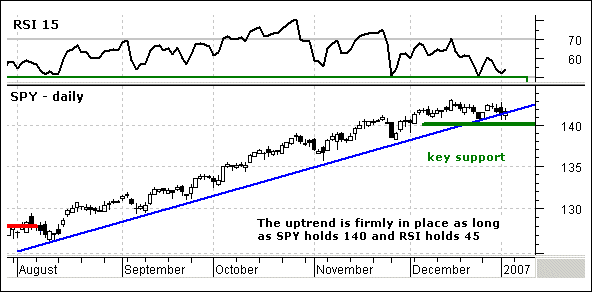
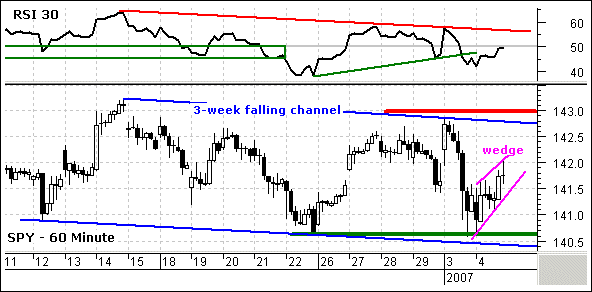
While QQQQ moved to a new high for theyear (above Wednesday’s high), SPY remains well below and the broadermarket is lagging. In other words, money rotated among the sectorsyesterday and SPY was caught in the middle. Technically, SPY has yet torecover from the big decline on 3-Jan and I find this negative. The ETFis, however, getting a bounce off support at 140.5. This bounce lookslike a rising wedge/flag and a move below 141 would signal acontinuation lower. This would project a support break at 140.5.
SPY remains in an uptrend on the dailychart and a three week falling price channel on the 60 minute chart.Strength in techs is a good sign, but I am watching support at 141 forsigns of weakness. As with SPY, I will wait for the dust to settle thisweek before considering directional bets.
***Russell 2000 iShares (IWM)***
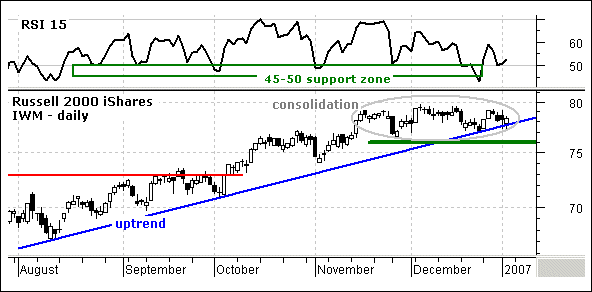
No change: The Russell 2000 iShares (IWM)remains in a consolidation on the daily chart with support at 76 andresistance at 80. The medium-term trend is up after the Jul-Nov advanceand this is just a rest as long as key support at 76 holds. A breakbelow 76 in RSI and 45 in RSI would reverse the current uptrend andcall for an extended correction.
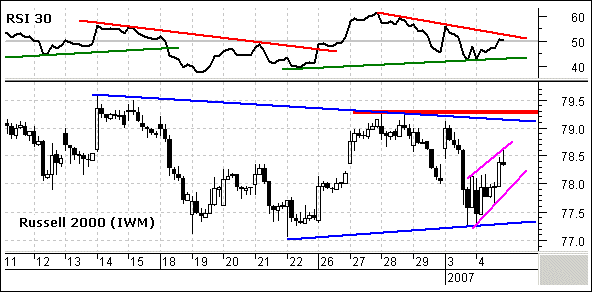
On the 60 minute chart, IWM consolidatedthe last three weeks with a triangle of sorts (blue trendlines). Thebreakout attempt on 3-Jan failed and the ETF bounced off support around77.5. This bounce looks like a rising wedge and a move below 77.5 wouldsignal a continuation lower. To get the bulls going, IWM needs to breakkey resistance at 79.3. RSI is also contracting and traders can lookfor range break to confirm a signal on the price chart. A break above55 would be short-term bullish and a break below 45 short-term bearish.
IWM remains range bound on the dailychart and range bound on the 60 minute chart. I still view the gap andfailure on Wednesday as bearish and this needs to be “undone” to turnbullish. As with QQQQ and SPY, I will wait for the dust to settle thisweek before considering directional bets.
***Stock Setups***
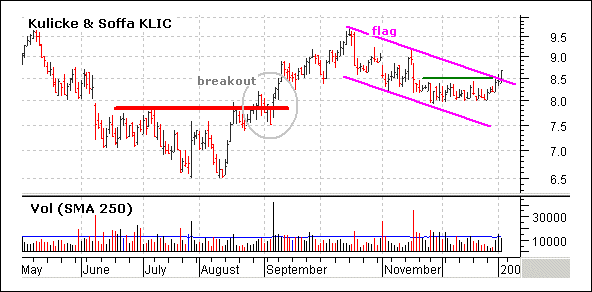
I highlighted Kulicke & Soffa (KLIC)in late December and this semiconductor is breaking out. The stockbroke resistance with a surge in Aug-Sep and then corrected with afalling flag. Notice that broken resistance turned into support around8. KLIC broke flag resistance with an advance over the last three daysand this is bullish. My upside target is around 10 and key support isat 8. A move below this level would negate the setup and be bearish.
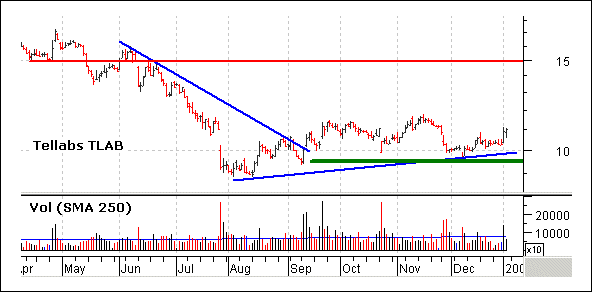
Tellabs (TLAB) is showing some promisethis year. The stock broke trendline resistance in early September andthe traded flat the next few months. The stock established supportaround 10 in October, November and December. Even with high volumeselling in late November, TLAB held 10 and bounced over the last twodays. Volume was above average on Wednesday and this further solidifiessupport. There is resistance at 12 from the Oct-Nov highs and thenaround 15. Failure to hold the New Year surge and a break below 9.5would be bearish.
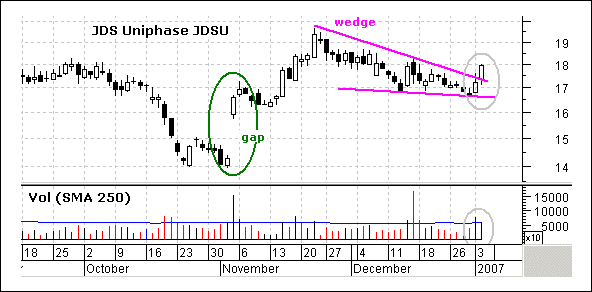
Networking stocks were hot the first twodays this year and JDS Uniphase (JDSU) broke wedge resistance. Thestock surged in November with a gap and big move above 19. The declineformed a falling wedge and the gap is holding. More importantly, JDSUbroke wedge resistance with a surge on good volume the last two days.The move reinforces support at 16.5 and it would take a move below thislevel to negate the breakout.
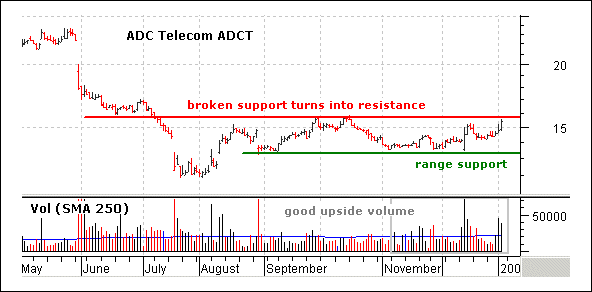
Also in the telecom equipment arena, I amseeing strength in ADC Telecom (ADCT). The stock fell on hard times inthe first half of 2006 and then consolidated in the second half. Thislooks like a base and the stock is rallying on good volume. Upsidevolume started creeping higher in November, surged in December andagain in early January. The stock is on the verge of a breakout at 16that would be most bullish.
***Breadth***
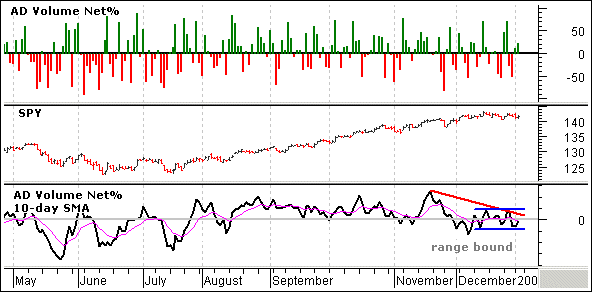
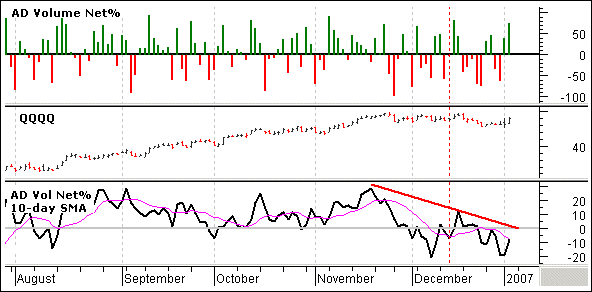
AD Volume Net% surged for QQQQ and endedslightly positive for SPY. It was not an inspiring performing from SPYand breadth remains bearish overall. The 10-day moving averages are innegative territory and we need to see some follow through beforeturning bullish on breadth.
Good day and good trading -Arthur Hill
---------------------------------------------------------------
Click here to post a comment, suggestion or question.
---------------------------------------------------------------
Disclaimer: Arthur Hill is not a registered investment advisor. Theanalysis presented is not a solicitation to buy, avoid, sell or sellshort any security. Anyone using this analysis does so at his or herown risk. Arthur Hill and TD Trader assume no liability for the use ofthis analysis. There is no guarantee that the facts are accurate orthat the analysis presented will be correct. Past performance does notguarantee future performance. Arthur Hill may have positions in thesecurities analyzed and these may have been taken before or after theanalysis was present.
--------------------------------------------------------
about: The Daily Swing is posted every trading day around 6AM ET andfocuses on short-term trends and price patterns. These can be as shortas a few days or as long as a few weeks.
--------------------------------------------------------
Sources: Data from Bloomberg.com, CBOT.com, Kitco.com and ino.com;Charting from Metastock (equis.com). Closing data from Reuters.com,eSignal.com, MS QuoteCenter and Yahoo! Finance.


