***Position Summary***
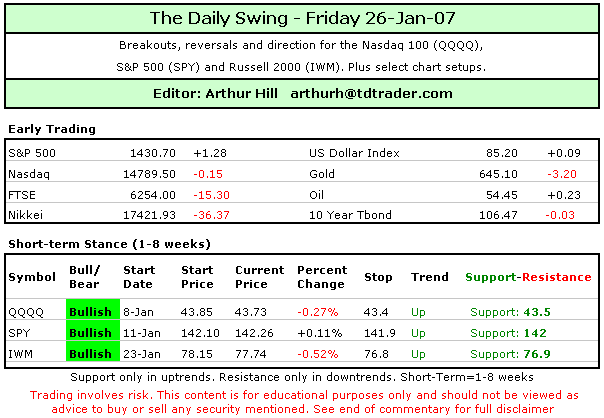
What a mess. QQQQ gave up all ofWednesday’s gains with a sharp decline on Thursday. Small-caps andlarge-caps were down sharply and all sectors move lower. Sellingpressure was about as broad as it could. The December-January rally inthe S&P 500 was pretty selective. Small-caps did not partake andtechs fell apart in mid January. In addition, the 10-day moving averagefor SPY breadth never broke range resistance and has been stuck atlower positive levels since mid December. Selective rallies are nothealthy. The medium-term uptrends have yet to reverse, but relativeweakness in small-caps and techs remains a big concern. Yesterday’s bigreversal day simply adds to this growing concern. The short-term trendsfor QQQQ and SPY are still up, but both are on the verge of reversalsand warrant a close watch. IWM is swinging within an eight week tradingrange and the swings are getting smaller. Something may be about tohappen. Stay tuned…..
***Technical Highlights***
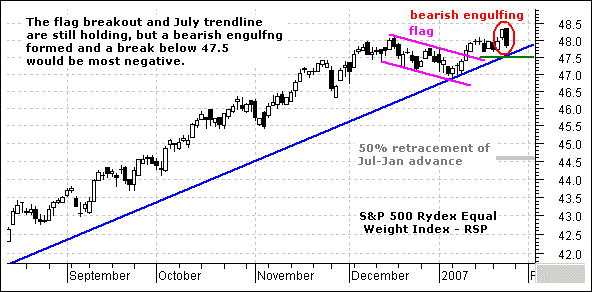
~Bad Reaction to New Highs~ The Dow and NYSE Composite recordednew all time highs on Wednesday and the stock market answered with abig broad based decline on Thursday. The Nasdaq, Nasdaq 100, NYSEComposite, S&P 500, Russell 2000 and S&P MidCap Index all lostover 1%. Volume was above average on the NYSE and the Nasdaq. This wasno small sell off and the depth of this negative reaction is a wake-upcall for the bulls. On the chart below, the S&P 500 Equal WeightIndex (RSP) formed a big bearish engulfing and the flag breakout isunder threat.
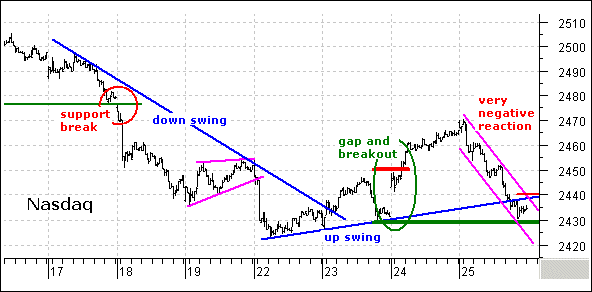
~Nasdaq Sinks~ After a gap up andshort-term breakout on Wednesday, the Nasdaq fell on Thursday with asteady decline throughout the day. The decline filled the gap anderased Wednesday’s gain. The index finished at support around 2430 andfurther weakness would turn the short-term swing bearish.
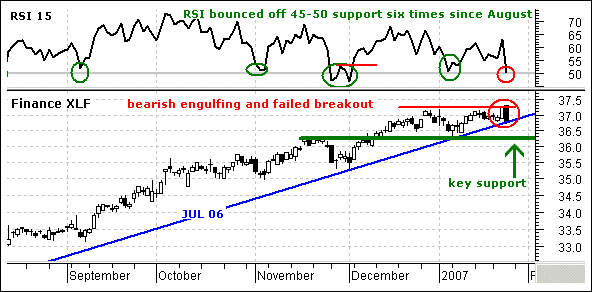
~A Bearish Engulfing for Finance~All nine sectors were down with four declining more than 1%(Technology, Consumer Discretionary, Energy and Finance). Surprisingly,the losses in the other five sectors were relatively modest. TheFinance SPDR (XLF) failed to hold its breakout and formed a big bearishengulfing yesterday. This is THE most important sector for the S&P500 ETF (SPY) and NYSE Composite. Banks are the backbone of theFinancial systems and brokers are the backbone of the stock market.Further weakness would confirm the bearish engulfing and a break belowthe January low would reverse the uptrend. RSI is trading at 45-50support for the seventh time and bullish momentum is getting achallenge. Will it hold or fold?
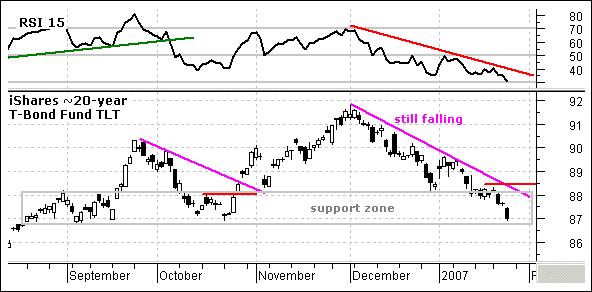
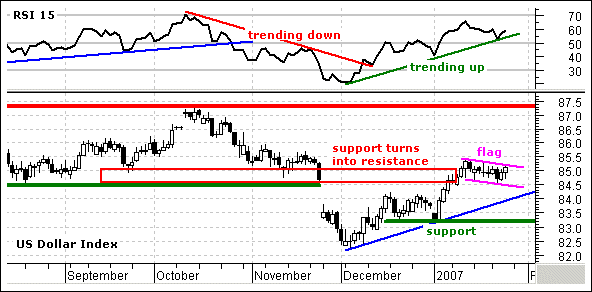
~Dollar and Bonds Diverge~ The USDollar Index firmed on Thursday and bonds sank. The 10-year T-NoteYield moved above 4.85% and the iShares ~20-year T-Bond Fund (TLT)declined below 87. TLT reached a support zone around 87-88 and RSI hit31. Despite support and an almost oversold RSI, TLT is still fallingand untouchable right now. The decline that began in December isrelentless and it would take a break above 88.5 to reverse this eightweek downtrend. The US Dollar is benefiting from higher interest ratesbecause foreign money is attracted to the higher returns. The US DollarIndex formed a falling flag over the last two weeks and a break above85.5 would be quite bullish. Look for a move below 84.5 in the indexand 50 in RSI to start a reversal of the eight week uptrend.
***Nasdaq 100 ETF (QQQQ)***
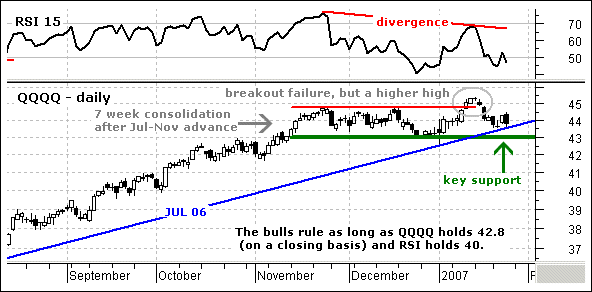
QQQQ is on the verge of a break down. TheETF failed to hold its mid January breakout at 44.7 and declined totrendline support. QQQQ firmed around 44 the last five days, but formedan outside reversal yesterday. This occurs when the open is above theprior close and the close is below the prior open. It is like a bearishengulfing and it shows a serious intraday reversal. Despite this bignegative, I will still hold out for a signal before turning bearish.Look for RSI to break 40 and QQQQ to break 42.8 (closing) for amedium-term trend reversal.
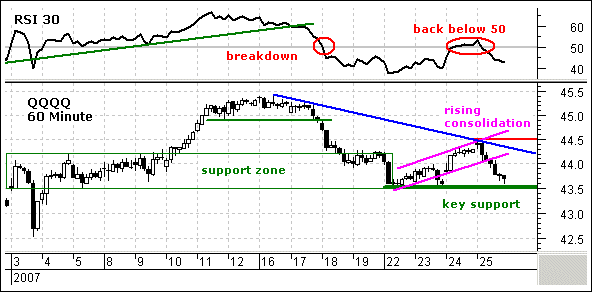
With yesterday’s sharp decline, I did arethink and redraw on the 60 minute chart. The decline from 16 to 22January was quite severe for just a correction and may be the start ofan extended decline. The rebound from 43.5 to 44.5 looks like a risingconsolidation and this is typical for corrective rally in a largerdowntrend. I drew through the 23-Jan low to form this rising flag(magenta trendlines). With QQQQ breaking the lower flag trendline andRSI breaking back below 50, the bears on are the verge of takingcontrol. Key support at 43.5 is the only thing standing in the way anda break below this level would be bearish.
I remain bullish on QQQQ because it isholding support, but find the current uptrend quite weak and on theverge of a reversal. Look for a break below 43.5 to reverse thisuptrend and start a downtrend.
***S&P 500 ETF (SPY)***
SPY moved sharply lower on Thursday andthe flag breakout is under threat. There is support from brokenresistance at 142 and this is confirmed by the July trendline. A breakbelow 142 would negate the flag breakout and show weakness. However,this would not be enough to reverse the medium-term uptrend. SPY stillhas a higher high at 143 and it would take a move below 140 to forge alower low (trend reversal).
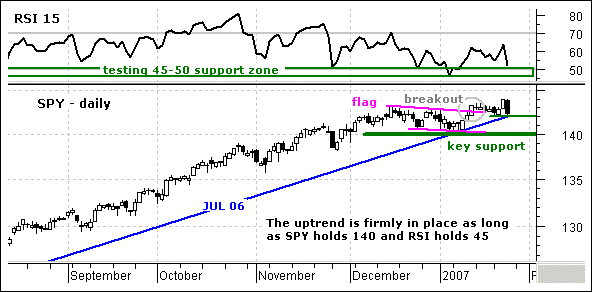
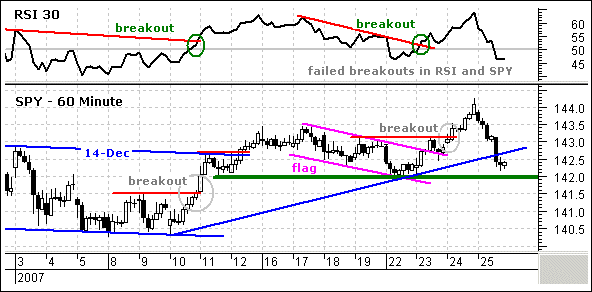
Wednesday’s breakouts have been turned ontheir heads. SPY broke flag resistance at 143 and moved right backbelow on Thursday. Similarly, RSI broke above 50 on Tuesday and movedright back below on Thursday. This is not how a strong ETF should actand the bulls should be put on notice. RSI firmed around 45 in theafternoon and SPY firmed around 142.142.5. These support zones mark thelast stand for the bulls. It is time to hold or fold. Failure to holdand a break below 142 in SPY and 45 in RSI would be short-term bearish.
I remain short-term bullish on SPY, but alot less confident in the uptrend. As noted yesterday, I closed 1/2 ofmy longs on the open and set the stop-loss for the remainder at 141.9.Closing 1/2 may limit gains and make the accounting messy, but it surehelps with peace of mind. 141.9 is my bearish trigger point.
***Russell 2000 iShares (IWM)***
No change: IWM remains stuck inconsolidation between 76 and 80. The August trendline confirms supportaround 76 and a break below this level would reverse the medium-termuptrend, which started in July. A break above consolidation resistanceat 80 would be bullish and signal a continuation of the Jul-Novadvance.
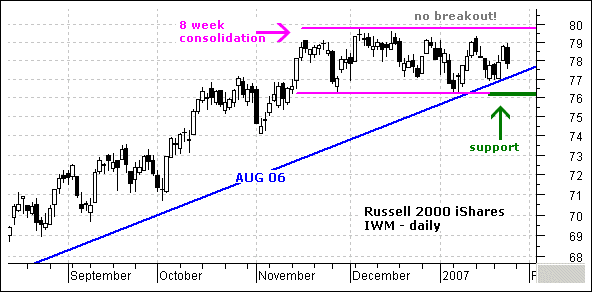
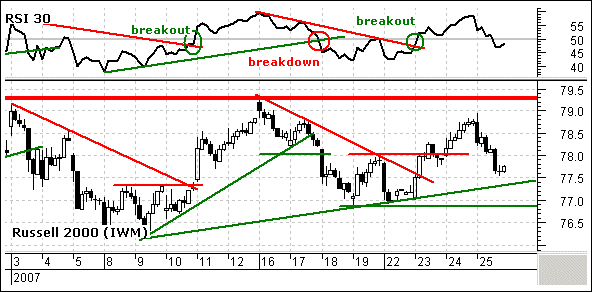
The swings within the trading range aregetting smaller and something could be about to happen. The ETF brokeresistance at 78 and RSI broke above 50 to turn the swing up onTuesday. IWM stopped short of its prior high (79.3) and yesterday’sdecline dealt a big setback to this swing. The five day trajectory isstill up, but the ETF needs to firm now to maintain this upwardtrajectory. A break below the 9-Jan trendline and support at 76.9 wouldturn the swing down.
IWM is a trading mess right now and Iwill continue to abide by the swings within the trading range. Thebreakout at 78 has already failed and I would not hold a losingposition once it fails like this. It is best to get out and wait foranother signal. A move to 76.8 would turn the current swing down.
***Stock Setups***
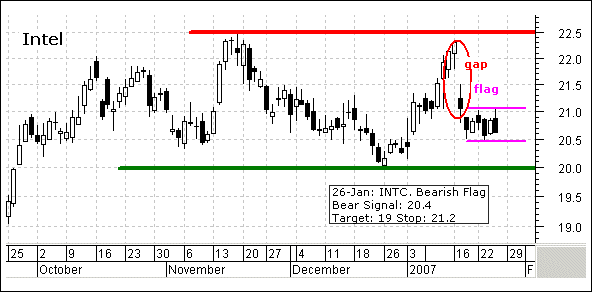
~INTC Cannot Get Up~ Intel (INTC)has fallen and cannot get up. The stock started the Nasdaq decline witha big gap down on 17-Jan. This gap is bearish and it is holding. Thestock consolidated the last six days and formed a flat flag. Watchthese boundaries for the next more. A break to 21.15 would beshort-term bullish and a break to 20.4 short-term bearish.
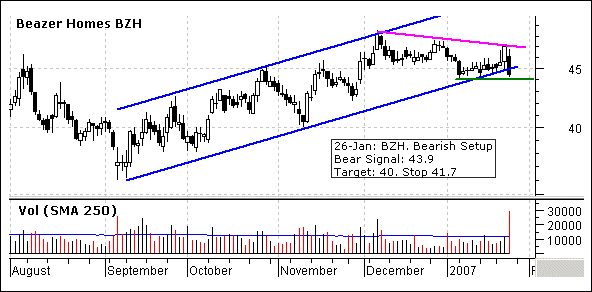
~BZH Breaking Down~ TheHomebuilders took a pretty good hit yesterday. Rising interest ratesare taking their tool. Beazer Homes (BZH) declined on heavy volume andthe stock broke the July trendline. There was a tight consolidationaround 45 in January and then a surge above 47 on Wednesday. This wasmet with a weak open and weak close on Thursday. Follow through below44 would break January support and target a decline to 40. For stopsand a bullish breakout, look for a move above the early Decembertrendline and Wednesday’s high (47.1).
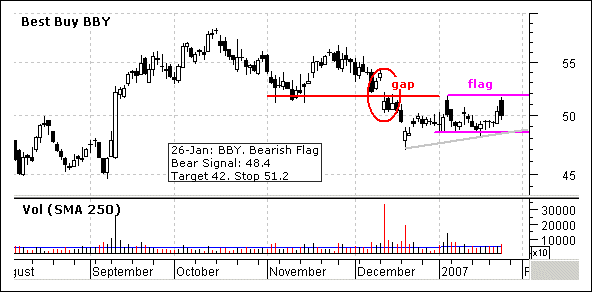
~BBY Hits Resistance~ Best Buy(BBY) has been lagging the S&P 500 since mid October and the stockconsolidated the last few weeks around 50. Relative weakness is anegative and the stock has yet to recover from its mid December gap.Broken support turned into resistance around 52 and this is the levelto watch for a breakout. The stock failed at 52 yesterday and a breakbelow 48.5 would signal another continuation lower. Caution is advisedbecause BBY is a risky and volatile stock.
***Breadth***
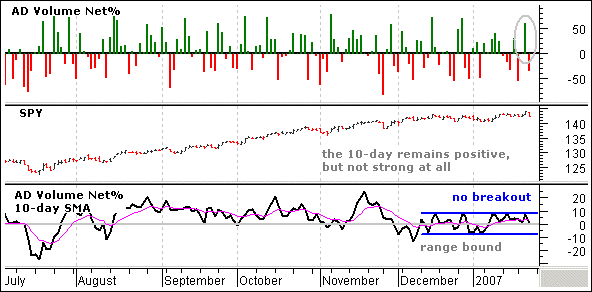
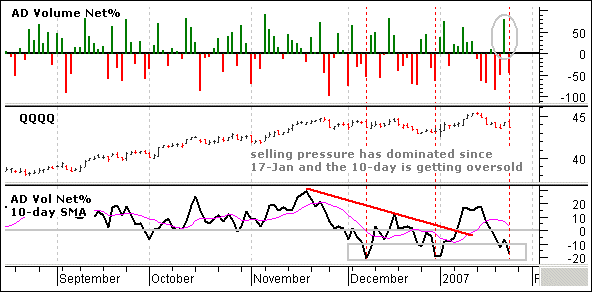
AD Volume Net% for SPY and QQQQ finishedlower on Thursday with QQQQ breadth leading the way lower. The 10-daySMA for QQQQ breadth is nearing the December lows and becomingoversold. However, there are no signs of strength and some sort ofbounce is needed to reverse the decline. The 10-day for SPY breadthremains positive, but range bound and not showing any real strength. Iam still looking for a break above 10 to unleash the bulls and a breakbelow –10 to turn bearish.
Good day and good trading -Arthur Hill
---------------------------------------------------------------
Click here to post a comment, suggestion or question.
---------------------------------------------------------------
Disclaimer: Arthur Hill is not a registered investment advisor. Theanalysis presented is not a solicitation to buy, avoid, sell or sellshort any security. Anyone using this analysis does so at his or herown risk. Arthur Hill and TD Trader assume no liability for the use ofthis analysis. There is no guarantee that the facts are accurate orthat the analysis presented will be correct. Past performance does notguarantee future performance. Arthur Hill may have positions in thesecurities analyzed and these may have been taken before or after theanalysis was present.
--------------------------------------------------------
about: The Daily Swing is posted every trading day around 6AM ET andfocuses on short-term trends and price patterns. These can be as shortas a few days or as long as a few weeks.
--------------------------------------------------------
Sources: Data from Bloomberg.com, CBOT.com, Kitco.com and ino.com;Charting from Metastock (equis.com). Closing data from Reuters.com,eSignal.com, MS QuoteCenter and Yahoo! Finance.


