Volume is simply the number of shares (or contracts) traded during a specified time frame (e.g., hour, day, week, month, etc). Volume provides clues as to the intensity of a given price move.
Low volume levels are characteristic of the indecisive expectations that typically occur during consolidation periods (i.e., periods where prices move sideways in a trading range). Low volume also often occurs during the indecisive period during market bottoms.
High volume levels are characteristic of market tops when there is a strong consensus that prices will move higher. High volume levels are also very common at the beginning of new trends (i.e., when prices break out of a trading range). Just before market bottoms, volume will often increase due to panic-driven selling.
Volume can help determine the health of an existing trend. A healthy up-trend should have higher volume on the upward legs of the trend, and lower volume on the downward (corrective) legs. A healthy downtrend usually has higher volume on the downward legs of the trend and lower volume on the upward (corrective) legs.
Examples
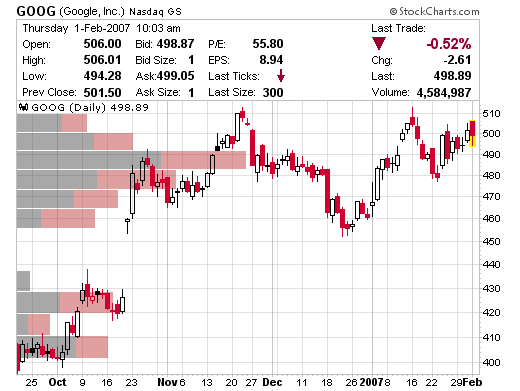
Volume by price range shows the volume at any given price range:
Note the absence of trading volume at the gap between 440-455 where no trades were made.

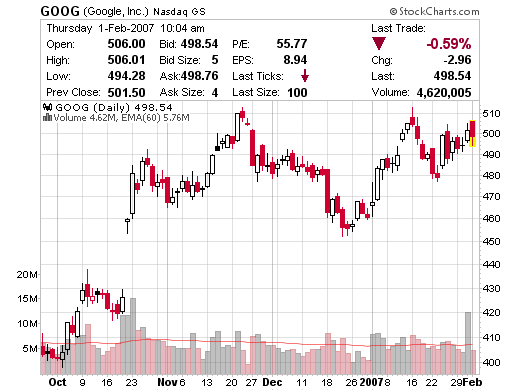
Regular volume just shows the number of contracts traded per unit of time measured (in this case days)


