***Position Summary***
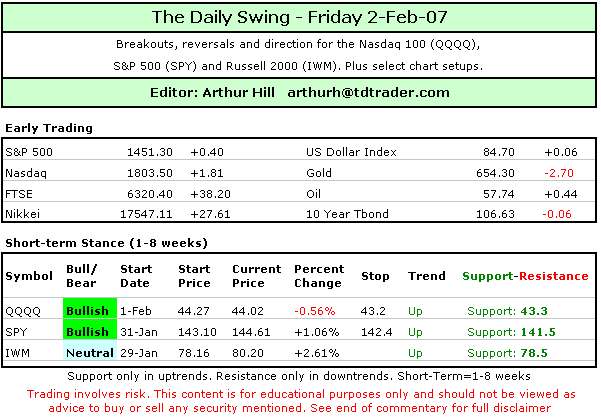
Wall Street is waiting on the employment report. The short-term trends for SPY, QQQQ and IWM are up. SPY shows the most strength, IWM broke to new highs yesterday and QQQQ continues to languish with the least relative strength. Relative weakness in tech stocks remains a big concern, but the other 80% of the market has yet to share this concern. That’s right. The Technology sector is less than 20% of the overall market and we should stay focused on the other 80%. The overall market is not in trouble until the other 80% says so. Today could be the day for QQQQ because the employment report could provide a needed spark for the bulls or nail for the bears. This report often produces a gap on the open and we should be focusing on post-gap price action. The market sometimes takes 30-45 minutes to settle and then the true colors emerge. A gap and upside follow through would be very bullish. A gap and downside follow through would be very bearish for QQQQ and a setback for the rest of the market.
***Technical Highlights***
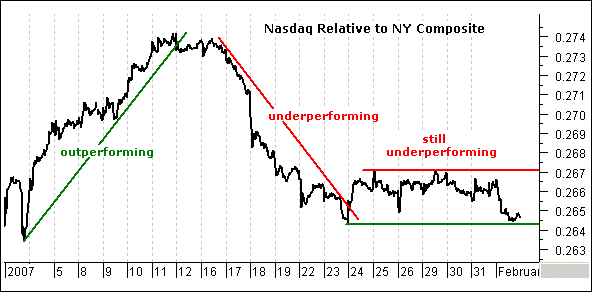
~Small-caps Lead and Techs Lag~ Stocks were broader higher again on Thursday with small-caps leading the way. The Russell 2000 gained .93% and the S&P SmallCap Index was up 1.13%. In contrast, the Nasdaq 100 closed down a fraction (-.05%) and the Nasdaq was up a fraction (+.18%). The Dow hit a new all time high and the S&P 500 was up around .5%. Except for relative weakness in Technology, it was not a bad day. In fact, the broader non-tech market has been strong the last few weeks. NYSE volume and Nasdaq volume was above average. There is plenty of buying interest in the NYSE, but still a lot of sellers in the Nasdaq. Nagging lagging in the Nasdaqs remains an ongoing concern and the chart below says it all. The Nasdaq outperformed from 3-Jan to 11-Jan and has been lagging ever since 16-January.
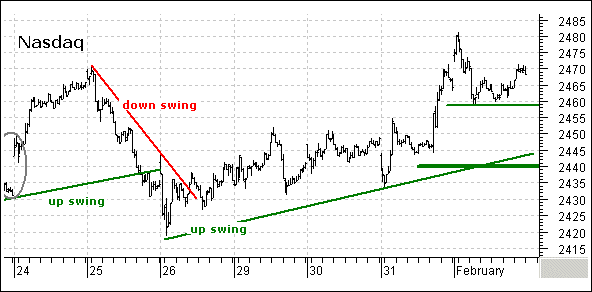
~Naz Stalls~ The Nasdaq gapped up on the open yesterday, pulled back sharply and then consolidated. I would attribute this to pre-employment report jitters. The current swing remains up with the first support at 2458 and the second support at 2440. A move below 2440 would break the upswing trendline and reverse this upswing. While a break below 2458 would be negative, there is still a big support zone around 2450 and the bulls have been resilient lately.
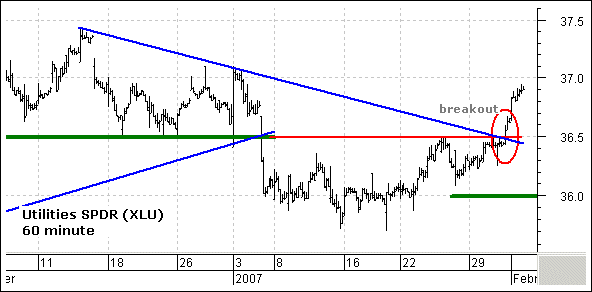
~Utilities Breakout~ Eight of the nine sectors were up on the day with (you guessed it) Technology being the only loser. The Materials SPDR (XLB) led the way higher with a 1.21% gain and recorded a new all time high. HealthCare, Industrials and Utilities were also strong. The Utility SPDR (XLU) surged above resistance at 36.5 to reverse the eight week downtrend. Notice that broken support turned into resistance and the 14-Dec trendline confirmed resistance around 36.5. The breakout signals a continuation of the bigger uptrend and I am marking key support at 36.
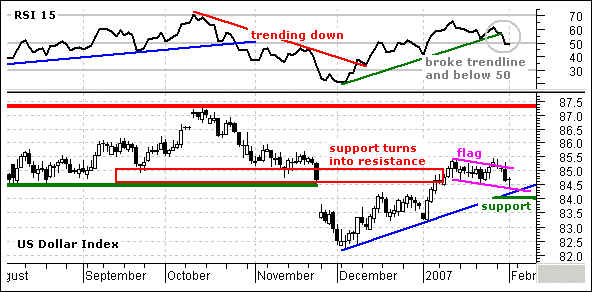
~US Dollar Index Weakens~ Gold and the US Dollar Index were up on Thursday, while bonds and the oil were down. I will cover the inter-market ETFs in the stock setups section below. For now, the US Dollar Index is starting to show signs of weakness and RSI broke below 50. The index failed to hold last week’s flag breakout and moved below 84.5 intraday. The index is still holding above the early December trendline and a break below 84 would call for a continuation of the Oct-Nov decline.
***Nasdaq 100 ETF (QQQQ)***
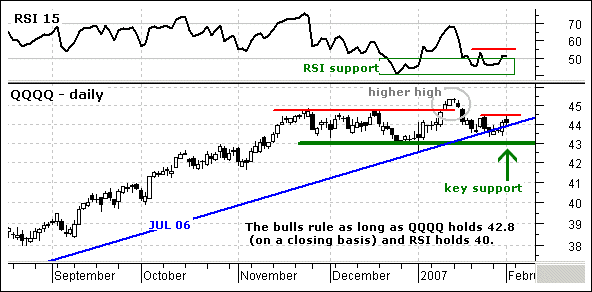
No change: Here we go again. QQQQ and RSI are firming at support. The ETF recorded a new high in early January, pulled back and held above its late December lows. This is positive and RSI is finding support around 40-50. This is also positive and traders should be on guard for a breakout. A move above 55 in RSI and 44.5 in QQQQ would provide the bullish trigger.
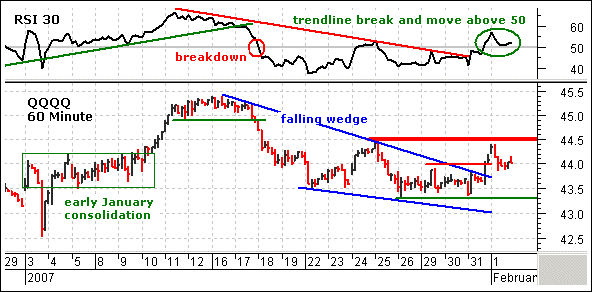
No change here either. The short-term evidence for QQQQ is turning bullish again. The ETF broke above the upper trendline of the falling wedge and exceeded consolidation resistance at 44. This coincided with a breakout in RSI and momentum now favors the bulls. This is the first bull signal and a break above key resistance at 44.5 would fully reverse the short-term downtrend. It takes a higher high to start an uptrend. At the very least, the breakout at 44 reinforces support at 43.3-43.5 and a breakout below this level would signal a continuation lower.
I elected to turn bullish on Thursday morning and am now at the mercy of the employment report. There is a bit of a buffer between current prices and key support (43.3). This means that QQQQ could absorb a gap down. The opening gap is not as important as what happens after the gap. Follow through (either way) is key: watch 44.5 up and 43.3 down.
***S&P 500 ETF (SPY)***
No Change: SPY bounced off broken resistance at 142 and the flag breakout is back in play. The ETF certainly took its time following through and yesterday’s gain marks the second follow through attempt in 12 days. RSI is bouncing off its support zone (45-50) and momentum remains bullish as long as this level holds. Key support for SPY is set at 140.
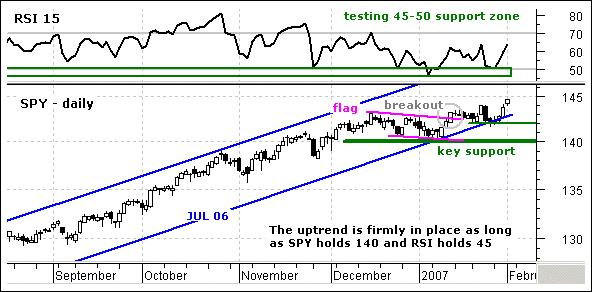
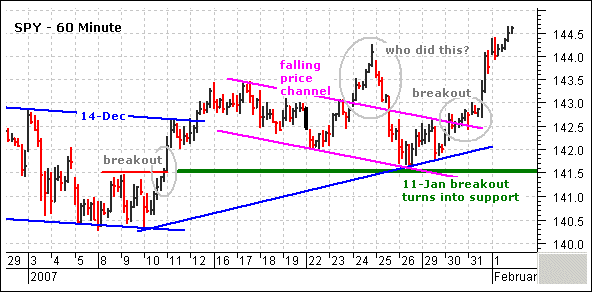
As noted yesterday, I am ignoring the last week’s pop-drop (Wed-Thur) and drawing a falling price channel from 16-Jan to 30-Jan. SPY broke above resistance at 141.5 with a surge above 143.5 in mid January and then corrected back to 141.5. Broken resistance at 141.5 turned into support and held last week. More importantly, SPY moved above the upper channel trendline and broke resistance at 143 with a strong move over the last three days. Broken resistance at 143 becomes support and this is the first level to watch for signs of trouble. Failure to hold the breakout and a move below 141.5 would reverse this short-term uptrend.
The short-term evidence is back with the bulls after the breakout at 143 on Wednesday. I still trust this market about as far as I can throw it and would set my stops pretty tight (142.4). In addition, I would also look for chances to take partial profits when/if possible (~146). The trend reverses on a move to 141.4.
***Russell 2000 iShares (IWM)***
Yes, there is a change on the daily chart as IWM closed above 80 finally. The move broke above consolidation resistance and small-caps are back in the game. This signals a continuation of the July-Nov advance and projects further strength towards the upper channel trendline (85). Before running out and buying IWM, I would like to point out that QQQQ fell back hard after its breakout and SPY has been zigzagging higher the last few months. IWM could also pullback into the support zone and/or start a zigzag higher. Over the next few days or weeks, there is probably going to be pullback that will offer a better risk-reward ratio.
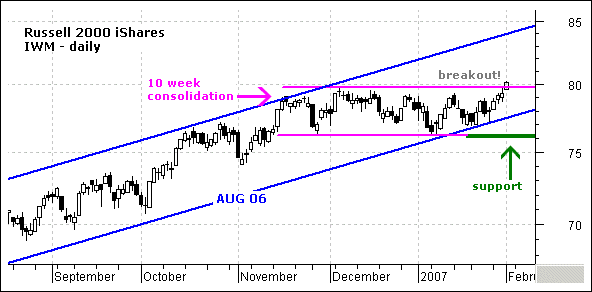
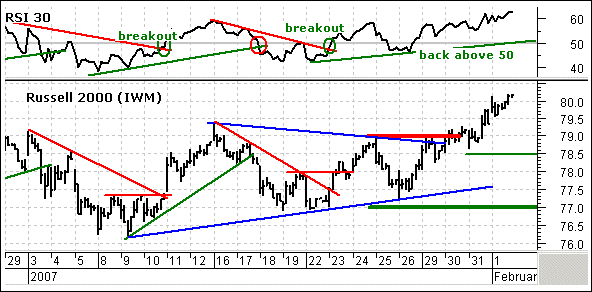
IWM is breaking out on the daily chart and is close to overbought on the 60 minute chart. The swing within the trading range has been up since 22-Jan and the break above 80 affirms this upswing. RSI is also above 50 and trading at its highest level since mid November. Broken resistance around 79 turns into support and I am marking my first support level at 78.5. A move below 78.5 in IWM and 50 in RSI would reverse the current upswing.
I remain neutral within this trading range because I do not want to turn bullish near resistance. The swing within the trading range is up, but resistance is at hand and traders should watch this one closely. Taking some profits (if available) near resistance is a good idea. The upswing shall remain bullish as long as RSI holds 50 and IWM holds 78.5.
***Stock Setups***
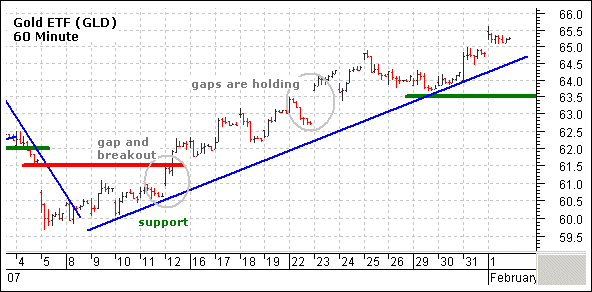
~GLD Remains Strong~ After taking a big hits in 3 and 4 January, the StreetTracks Gold ETF (GLD) firmed and then rallied the rest of the month. The (almost) 10% move is quite impressive and GLD remains in a firm uptrend. There is resistance around 65-66 from the Jul-Aug highs and GLD is short-term overbought, but I see no signs of weakness. I am setting key support at 63.5 and will remain short-term bullish as long as this level holds.
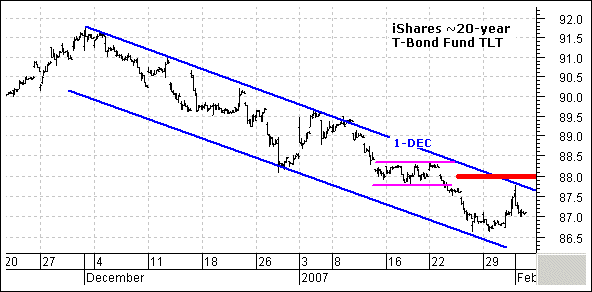
~TLT Remains in Downtrend~ The iShares ~20-year T-Bond Fund (TLT) surged on Wednesday and then fell back on Thursday to keep the falling price channel alive. With Thursday’s decline, I am lowering key resistance and will turn short-term bullish on a break above 88. Such a move would exceed the upper channel trendline and forge a higher high. I would then set key support at 86.5.
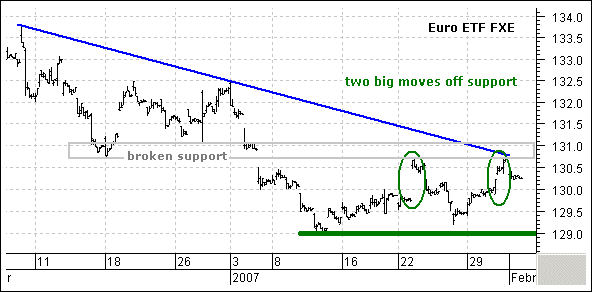
~Euro Meets Resistance~ The Euro Currency Trust (FXE) surged off support over the last two weeks, but met resistance near broken support and has yet to turn the corner. The ETF broke support around 131 in early January and this level turns into resistance. This resistance level is also confirmed by the December trendline. The bounces off support are impressive, but it would take a break above 131 to fully reverse the downtrend. TLT and FXE have been following each other the last two months and both are on the verge of short-term trend reversals.
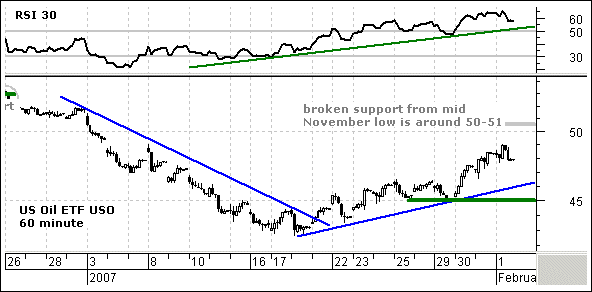
~USO Extends Oversold Bounce~ The U.S. Oil Fund ETF (USO) bottomed in mid January and has been moving higher the last two week. I still consider the big trend for oil to be down and this is a corrective advance. Broken support (November low) is around 50 and this is the upside target for this bounce. RSI is trending higher and above 50 to keep momentum bullish. A break below 50 in RSI would be the first negative sign and a break below 45 in USO would reverse the short-term uptrend.
***Breadth***
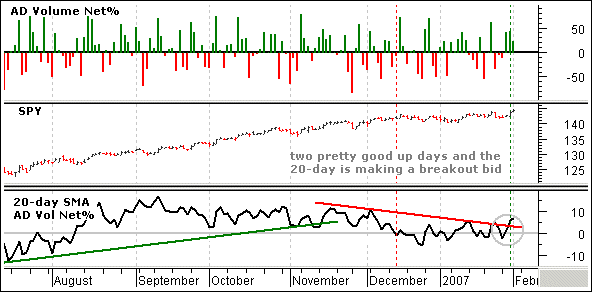
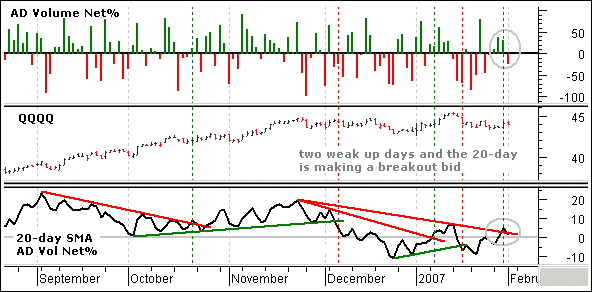
AD Volume Net% finished positive for SPY and negative for QQQQ. Breadth stats echo the price charts. QQQQ is relatively weak and SPY is relatively strong. The 20-day moving average for SPY breadth broke out and is bullish. The 20-day moving average for QQQQ breadth fell back and further weakness into negative territory would be bearish. This is the make-or-break day for QQQQ breadth.
Good day and good trading -Arthur Hill
---------------------------------------------------------------
Click here to post a comment, suggestion or question.
---------------------------------------------------------------
Disclaimer: Arthur Hill is not a registered investment advisor. The analysis presented is not a solicitation to buy, avoid, sell or sell short any security. Anyone using this analysis does so at his or her own risk. Arthur Hill and TD Trader assume no liability for the use of this analysis. There is no guarantee that the facts are accurate or that the analysis presented will be correct. Past performance does not guarantee future performance. Arthur Hill may have positions in the securities analyzed and these may have been taken before or after the analysis was present.
--------------------------------------------------------
about: The Daily Swing is posted every trading day around 6AM ET and focuses on short-term trends and price patterns. These can be as short as a few days or as long as a few weeks.
--------------------------------------------------------
Sources: Data from Bloomberg.com, CBOT.com, Kitco.com and ino.com; Charting from Metastock (equis.com). Closing data from Reuters.com, eSignal.com, MS QuoteCenter and Yahoo! Finance.


