***Position Summary***
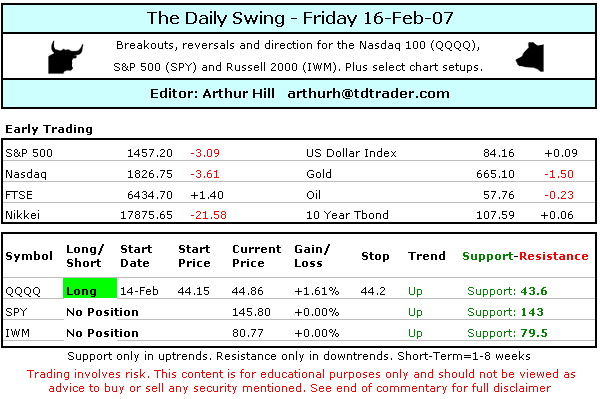
Stocks held their gains and Bernanke held is nerve in frontof Congress. The tech bulls made a statement on Wednesday and I am now looking for, youguessed it, follow through. This was the fourth surge since 24-Jan and the prior threefailed. I was impressed with the ability of QQQQ to edge higher throughout the sessionyesterday and I am now looking for a move to 45 to seal a breakout on the daily chart. Theshort-term trends for IWM, QQQQ and SPY are up. IWM is faltering a bit, SPY is nearingresistance from the upper channel and QQQQ already hit upper channel resistance. This isthe point where the short-term uptrend either accelerates higher or pulls back to keeptrading choppy.
***Technical Highlights***
~Stocks Hold Gains~ Stocks edged higher yesterday andmost of the major indices finished up on the day. The S&P 100 and Dow Composite werethe only two losers as the Dow Transports and Dow Utilities weighed on the Dow Composite.On Wednesday, the Dow Industrials, Utilities and Transports all recorded 52-week highs.Sounds like a Dow Theory confirmation to me. The Nasdaqs led the way higher with modestgains on average volume. NSYE volume was below average.
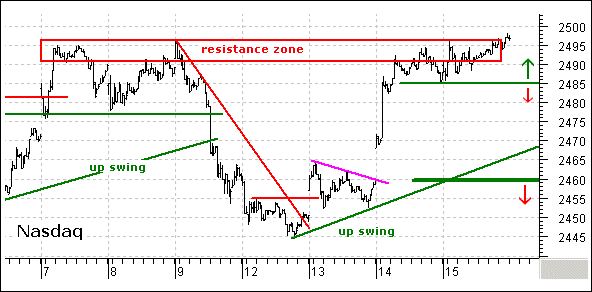
~XLE Gaps Lower~ Seven of the nine sectors were up onthe day and the gains were all modest. Consumer Staples, HealthCare and Materials led theway. The Energy and Utilities moved lower. I am still watching the Energy SPDR (XLE)closely. The ETF broke wedge support with a gap down on Monday, rebounded and gapped downagain on Friday. RSI is trending lower and this sector looks vulnerable to furtherweakness. Look for a break below 57.5 to start a move lower and a break above 59 to revivethe bulls.
***Nasdaq 100 ETF (QQQQ)***
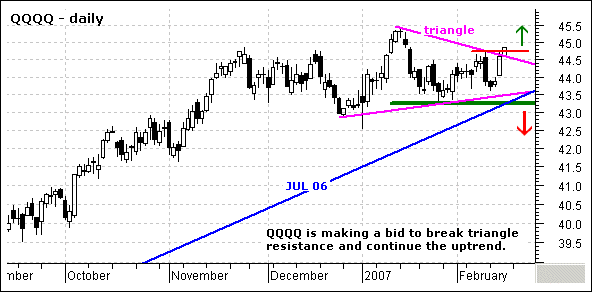
The daily chart is for reference with analysis details notedon the chart. Detailed commentary is provided the first day of every week.
 gifs/d0216_qqqq_i.gif
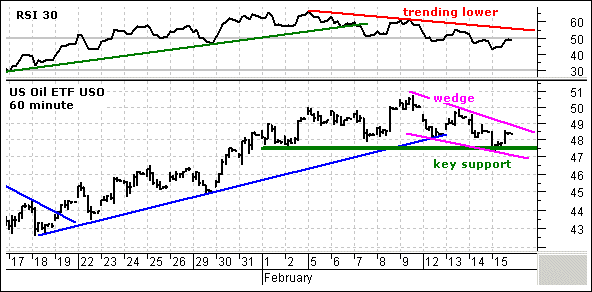
QQQQ broke above the upper triangle trendline on Wednesdayand edged above last week’s high on Thursday. This breakout is quite positive and the20-day SMA for QQQQ breadth is also breaking into positive territory. This ETF is on theverge of a bull signal on the daily chart and I think a move to 45 would do the trick. Onthe 60 minute chart, the advance over the last four weeks has been quite choppy (magentatrendlines) and a sharp decline below 44.5 would be negative. The red dotted lines showprior pullbacks that were quite sharp. A strong ETF should hold its gains and I think amove below 44.5 would put QQQQ back into this choppy mode. The short-term uptrend wouldreverse on a break below 43.6.
Long from 44.15 on 14-Feb. QQQQ shows no signs of weaknessjust yet, but I am going to go ahead and divide my current position by setting two stops.The first is at 44.65 to lock in 1/2 point profit and the second is at 43.55.
***S&P 500 ETF (SPY)***
The daily chart is for reference with analysis details notedon the chart. Detailed commentary is provided the first day of every week.
 gifs/d0216_spy_i.gif
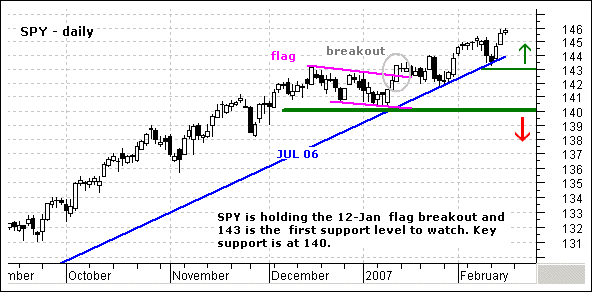
SPY gapped up, surged above last week’s high andconsolidated the last 1 1/2 days. Overall, the ETF remains within a rising price channeland the upper trendline marks resistance around 146.5. I am marking minor support at 145.3and a break below this level would argue for a pullback within this rising price channel.So far, the gap and surge are holding and there is not reason to be short-term bearish.Breadth is trending up and it would take a break below 143 to reverse the uptrend in SPY.
No position and no change. Breadth is working its way higheragain as the 20-day surged back into positive territory. SPY is clearly trending up andremains in an uptrend. It is getting a little overextended and it is late for new longs,but the uptrend is far from weak. Look for a break below 143 to reverse this uptrend.
***Russell 2000 iShares (IWM)***
The daily chart is for reference with analysis details notedon the chart. Detailed commentary is provided the first day of every week.
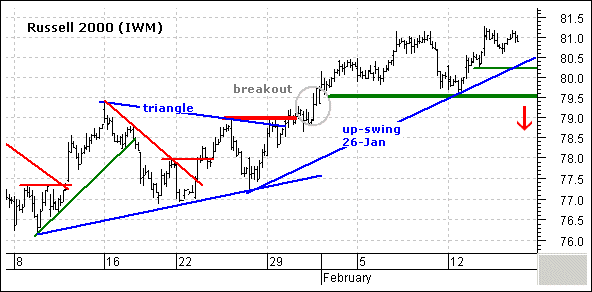
IWM is loosing its leadership role to QQQQ. The ETF surgedin the first hour of trading on Wednesday and then stalled around 81. IWM has yet to showany weakness and remains above the first support level at 80.2. A move below this levelwould break the 26-Jan trendline. I am leaving key support at 79.5 and this level holdsthe key to the short-term uptrend.
No position. 1-2 days of relative weakness is a concern, butnot a problem yet. The short-term trend is firmly up as long as 80.2 holds and the bullshave little to worry about until a break below this level. I will wait for some weaknessbefore considering a trend change.
***Stock Setups***
~MLNM Remains on the Radar~ Millennium Pharma (MLNM)took a hit on Monday, but managed to firm and even bounced on Thursday. The stock remainswithin a falling flag pattern and I am watching resistance at 11.6 for a breakout. A surgeto 11.7 would trigger the bull signal and target a move to around 14-15. I would then setsupport at 10.9 and a break to 10.8 would be bearish.
~BEAS Bounces on Good Volume~ BEA Systems (BEAS) washighlighted on 31-Jan with a consolidation and good upside volume. The stock never hit thebull trigger at 13.1, but shows promise with a three day move. Yesterday’s advancewas on good volume and further strength to 13.10 would hit the bullish trigger. I wouldtarget a move to 15.5 and set a stop at 11.9.
Good day and good trading -Arthur Hill
---------------------------------------------------------------
Click here to posta comment, suggestion or question.
---------------------------------------------------------------
Disclaimer: Arthur Hill is not a registered investment advisor. The analysis presented isnot a solicitation to buy, avoid, sell or sell short any security. Anyone using thisanalysis does so at his or her own risk. Arthur Hill and TD Trader assume no liability forthe use of this analysis. There is no guarantee that the facts are accurate or that theanalysis presented will be correct. Past performance does not guarantee futureperformance. Arthur Hill may have positions in the securities analyzed and these may havebeen taken before or after the analysis was present.
--------------------------------------------------------
about: The Daily Swing is posted every trading day around 6AM ET and focuses on short-termtrends and price patterns. These can be as short as a few days or as long as a few weeks.
--------------------------------------------------------
Sources: Data from Bloomberg.com, CBOT.com, Kitco.com and ino.com; Charting from Metastock(equis.com). Closing data from Reuters.com, eSignal.com, MS QuoteCenter and Yahoo!Finance.


