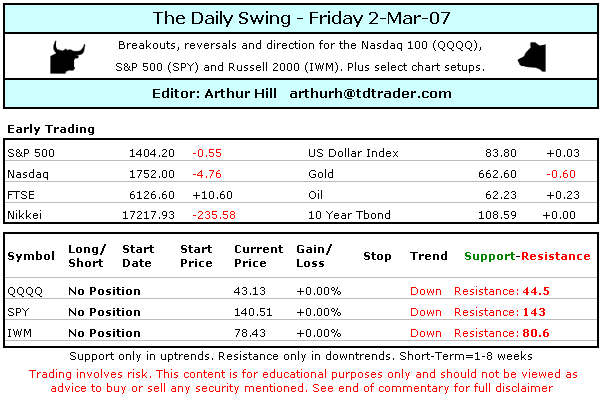
***Position Summary***
Tuesday’s gap and support breaks serve asa warning to bulls. Thursday’s recovery sends a clear message to thebears. Trading is not fit for man or beast. The bulls and bears areslugging it out and we should be prepared for further volatility,especially as volume remains high, very high. While a oversold bounceis possible, it is Friday and I would not expect aggressive buyingahead of the weekend. An oversold bounce could materialize next weekthough. Even with yesterday’s recoveries, the short-term trends aredown and the bears have the edge for QQQQ, SPY and IWM. In fact, thisis a good sport for aggressive traders to establish shorts with astop-loss just above the Wednesday afternoon highs. Intra-day decisionsand adjustments are required.
***Technical Highlights***
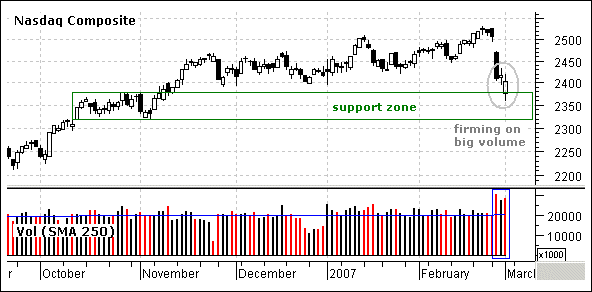
~Big Recovery~ Even though the major indices all finished loweron the day, they ended the day well above their opening lows and therecovery was impressive. Some indices even moved into positiveterritory in the afternoon, but all closed with small losses after adip in the final hour. The Russell 2000 and S&P 500 had thesmallest losses . Volume was well above average for the third dayrunning. Except for the selling pressure on the open, most of thisvolume can be attributed to buying and the recovery.
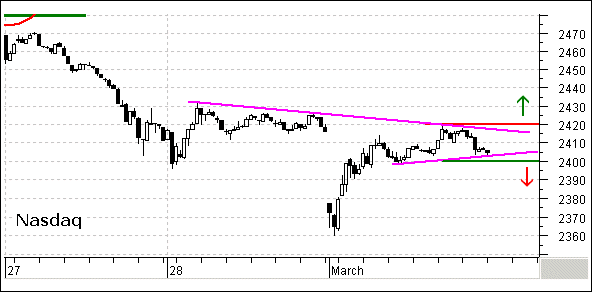
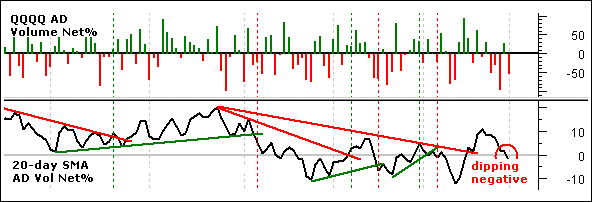
~Nasdaq Consolidates~ This Nasdaqcharts shows the opening gap, sharp recovery and subsequentconsolidation quite well. Keeping treacherous seas in mind, aggressivetraders should watch this consolidation for the next signal. A breakabove consolidation resistance would be short-term bullish and a breakbelow would be short-term bearish. These levels can be used to setstops.
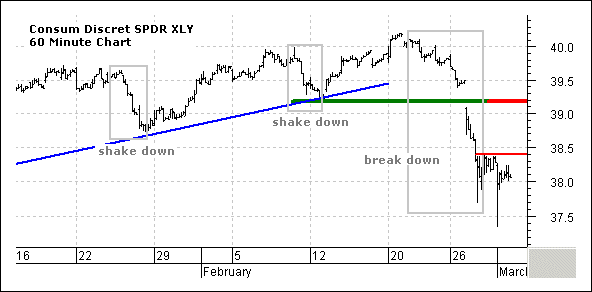
~More Than Just a Shake Down~ Sixof the nine sectors finished lower. The Consumer Staples SPDR (XLP) wasunchanged, the Information Technology SPDR (XLK) eked out a gain andthe Utility SPDR (XLU) was up .52%. The Consumer Discretionary SPDR(XLY) chart is pretty representative of the other nine sectors over thelast three days. The ETF broke down with a support break at 39.2 andstalled around 38 the last two days. There were two forays below 37.7,but XLY bounced back each time. Look for a break above the Wednesdayafternoon high (38.4) to start an oversold bounce that could carry tothe gap/support break around 39.2.
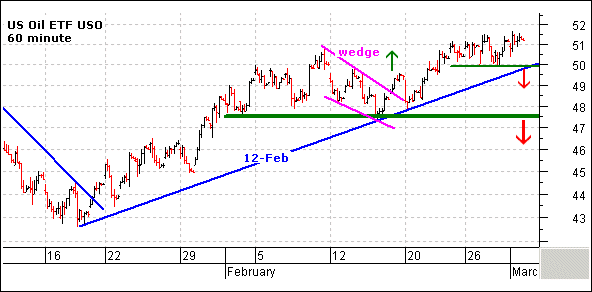
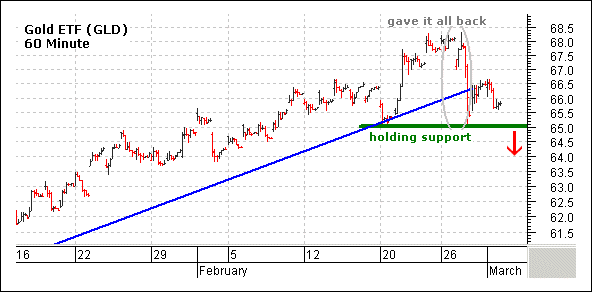
~Gold and Oil Hold Firm~ Goldstocks and Energy stocks took hits over the last few days, but gold andoil held firm. In fact, the U.S. Oil Fund ETF (USO) actually edgedhigher and is holding its wedge breakout from 16-Feb (green arrow). USOhas minor support at 50 and key support at 47.5. The oil bulls are ingood shape as long as 50 holds. The StreetTracks Gold ETF (GLD) gaveback the gains from its 21-Feb surge, but managed to hold support at 65and I am still bullish. This level holds the key for the bullion bulls.
***Nasdaq 100 ETF (QQQQ)***
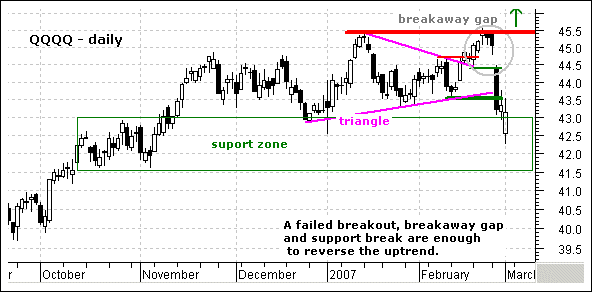
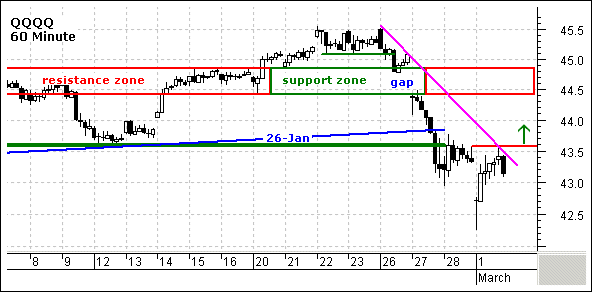
First and foremost, the gap down andtriangle break on the daily chart are medium-term bearish. However,there is a support zone around 41.5-43 and QQQQ is putting up a fightwith a big recovery yesterday. On the 60 minute chart, the ETFconsolidated around 43-43.6 the last two days and the swing is down(magenta trendline). A break above 43.6 would turn the swing up andargue for a run towards the gap/resistance zone around 44.5-44.8. Thereis an aggressive trade here, but tight stops and intraday adjustmentsare required. As long as 43.6 holds, the bears have the upper hand forthe short-term.
No position. QQQQ was down 2.3% onyesterday’s low and then rallied back to positive territory in theafternoon (+2.3%). Intra-day decisions and adjustments are requiredright now and I will wait for things to calm down.
***S&P 500 ETF (SPY)***
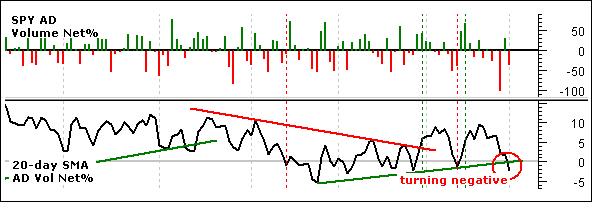
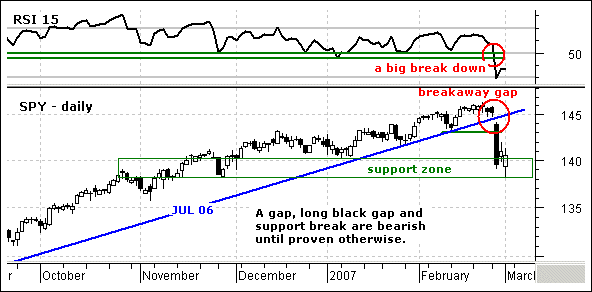
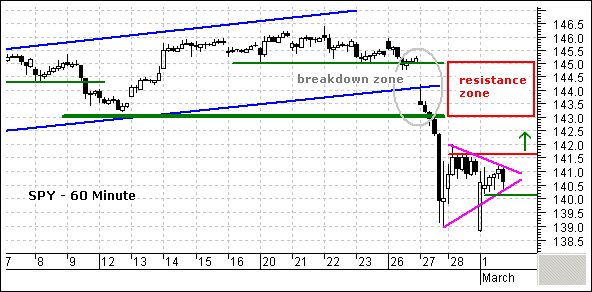
On the daily chart, the gap down, supportbreak at 143 and RSI plunge to 30 are medium-term bearish. Even thoughthere is a support zone around 138-140 and SPY firmed over the last twodays, I need to see more before treating Tuesday’s decline as anoverreaction. On the 60 minute chart, SPY dipped below 139.5 twice andrecovered twice. There is resistance at 141.6 from the Wednesdayafternoon highs and a break above this level would turn the short-termswing up. I would view this as an oversold bounce and expect resistancearound 143-145. Sorry for the big zone, but this is the size of thebreakdown zone (gray oval). The bears rule as long as SPY remains below141.6 and a break below 140 could start another leg lower.
No position. Intra-day decisions and adjustments are required right now and I will wait for things to calm down.
***Russell 2000 iShares (IWM)***
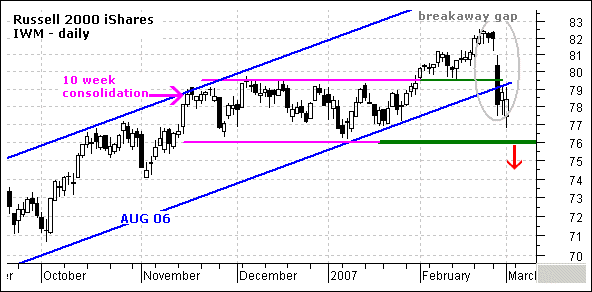
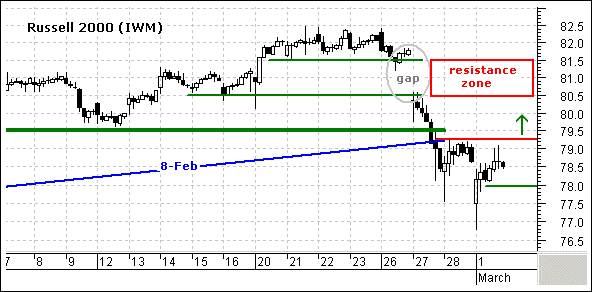
On the daily chart, the breakaway gap andbreak below 79.5 are big negatives, but IWM remains above key supportat 76 and I am not ready to turn bearish just yet. The ETF is firmingin the consolidation zone and the bulls are not finished just yet. Onthe 60 minute chart, IWM dipped below 78 twice and recovered twice. Therecovered there stopped short and the ETF established resistance at79.3. A break above this level would turn the short-term swing up andargue for an oversold bounce. The upside target is the resistance zonearound 80.5-81.5. This zone stems from the gap down and support breaks.The bears have the short-term edge as long as 79.3 holds and a breakbelow 78 could signal another leg lower.
No position. Intra-day decisions and adjustments are required right now and I will wait for things to calm down.
***Stock Setups***
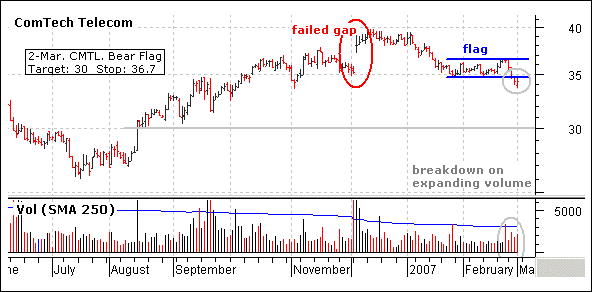
~CMTL Breaks Flag Support~ ComTechTelecom (CMTL) did not partake in market strength in February and brokeflag support over the last four days. The decline occurred on expandingvolume and this signals a continuation of the January decline. Alsonotice that the December gap failed to hold. The current price is34.33, the downside target is support around 30 and a move to 36.7would negate this signal.
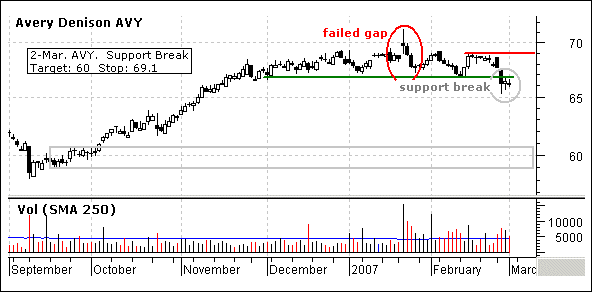
~AVY Breaks Support~ AveryDennison (AVY) stalled from late November to late February and brokesupport at 67 with a sharp decline this week. The decline stems frommarket weakness and this stock will likely go the way of the overallmarket. The stock failed to hold a gap up on 23-Jan and the supportbreak targets further weakness to around 60. A move above consolidationresistance at 69 would negate the signal.
Good day and good trading -Arthur Hill
---------------------------------------------------------------
Click here to post a comment, suggestion or question.
---------------------------------------------------------------
Disclaimer: Arthur Hill is not a registered investment advisor. Theanalysis presented is not a solicitation to buy, avoid, sell or sellshort any security. Anyone using this analysis does so at his or herown risk. Arthur Hill and TD Trader assume no liability for the use ofthis analysis. There is no guarantee that the facts are accurate orthat the analysis presented will be correct. Past performance does notguarantee future performance. Arthur Hill may have positions in thesecurities analyzed and these may have been taken before or after theanalysis was present.
--------------------------------------------------------
about: The Daily Swing is posted every trading day around 6AM ET andfocuses on short-term trends and price patterns. These can be as shortas a few days or as long as a few weeks.
--------------------------------------------------------
Sources: Data from Bloomberg.com, CBOT.com, Kitco.com and ino.com;Charting from Metastock (equis.com). Closing data from Reuters.com,eSignal.com, MS QuoteCenter and Yahoo! Finance.


