***Position Summary***
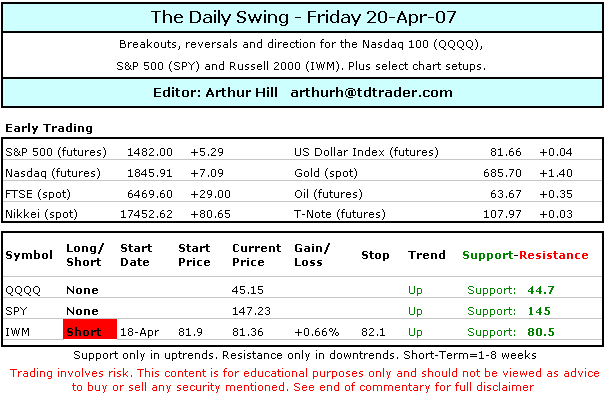
Price action is first and foremost.Breadth, momentum, volume and all other indicators are a distantsecond. I am not impressed with breadth over the last few days andbroader market has been mixed as the Dow pushes to new all time highs.However, there is no denying that the trends since mid March are up andthe bulls are showing some serious resilience. QQQQ and SPY are holdingMonday’s gaps, but IWM filled Monday’s gap and small-caps are showingrelative weakness over the last three days. In addition, techs arestill lagging because QQQQ and the Nasdaq have yet to break theirFebruary highs. In contrast, DIA and SPY are trading above theirFebruary highs and these are the real leaders. Relative weakness intechs and small-caps sends a clear warning sign, but price action hasyet to oblige with a breakdown. Money is made or lost based on priceaction, not indicators. While I will respect the current uptrends, Iremain quite skeptical of this advance and continue to believe themarket is ripe for a pullback or consolidation. I am currently shortIWM and will remain short as long a relative weakness resists. I willremain out of QQQQ and SPY until some evidence of weakness emerges onthe price charts.
***Technical Highlights***
~Mostly Lower~ Stocks were mostly lower on Thursday withsmall-caps leading the way lower. The Dow was the only major index toclose higher and the Average eked out another all time high. The NYSEComposite and Nasdaq closed slightly lower and volume for both was thehighest since 22-Mar.
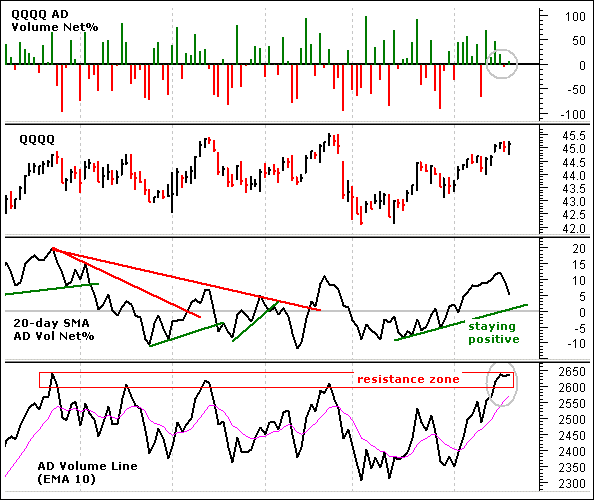
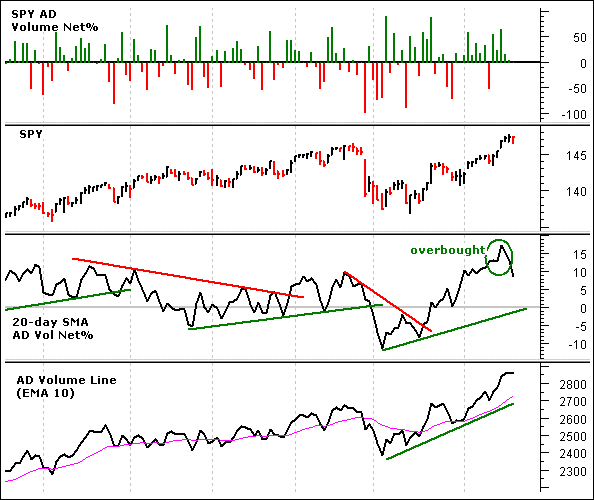
Of the Dow Jones industry groups, 28 wereup and 70 were down. Airlines, precious metals and hotels were weak,while biotechs, rails, grocery stores and semis were strong. Industrygroup weakness was also reflected in the breadth stats. AD Volume Net%for SPY was slightly negative and AD Volume Net% for QQQQ was slightlypositive.
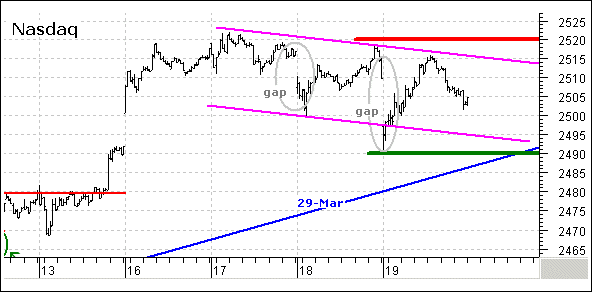
The Nasdaq chart below shows just howresilient the bulls have been. The index gapped down each of the lasttwo days, firmed in the first hour and then recovered most of itslosses. The overall trend is down for the last three days, but theability to recover after the gap shows some serious buying pressure anda break above 2520 would be bullish.
***Nasdaq 100 ETF (QQQQ)***
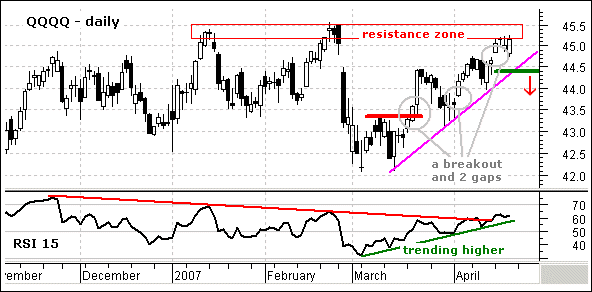
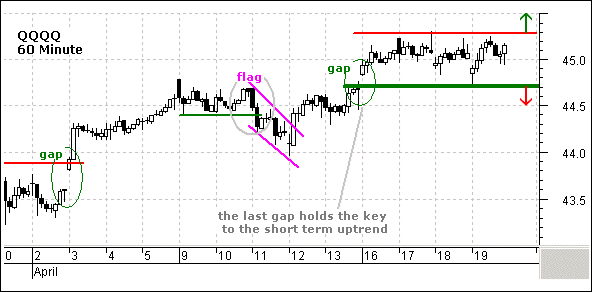
QQQQ is holding the gap and remainingstrong. The ETF opened weak and closed strong to form a long whitecandlestick on the day. The move reinforces gap support and keeps theuptrend alive. Even though the ETF is trading near a stiff resistancezone, the trend since mid March is clearly up and we must expect higherprices until there is some sort of break down. It would take a closebelow 44.4 to break the March trendline and fill Monday’s gap. Momentumis also steadily advancing as RSI works its way higher. It would take amove below 50 to turn momentum bearish. On the 60 minute chart, QQQQsurged above 44.7 and then consolidated the last 3-4 days. The ETFgapped below 45 the last two mornings, but recovered and closed above45 the last two days. This shows some serious resilience and large-captechs are quite strong. I am setting key short-term support at 44.7 anda break below this level would reverse the short-term uptrend. A moveabove 45.3 would break consolidation resistance and signal acontinuation of the uptrend.
Position: No Position. I went on atop picking expedition again yesterday and got stopped out for a 45cent loss. Gaps and recoveries make life real difficult. Moreover, theyshow resilience and it looks like a breakout could be in the cards now.The market is showing too much resilience to justify top picking rightnow, but I am also wary of long positions as the market gets overboughtand breadth deteriorates.
***S&P 500 ETF (SPY)***
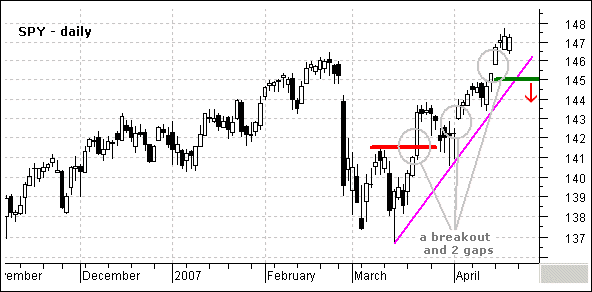
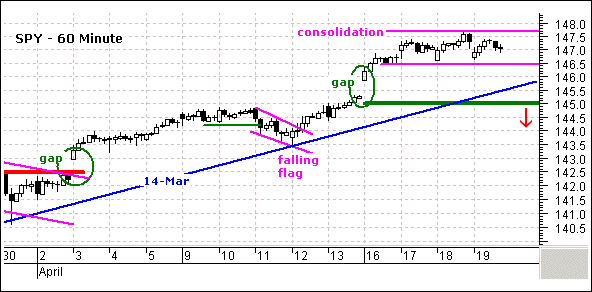
SPY remains in a clear uptrend on thedaily chart and the bulls are showing some serious strength over thelast six days. The ETF gapped up on Monday and this gap is holding. Inaddition, the March trendline remains unscathed and there are no signsof weakness. A downtrend cannot start without some signs of weaknessand I am marking key support at 145. A move below this level wouldbreak the March trendline and fill the gap. Until then, we shouldexpect higher prices, even if SPY is overbought and looking ripe for apullback. On the 60 minute chart, SPY surged above 146.5 and thenconsolidated the last 3-4 days. With the overall trend up, a breakoutat 147.7 would signal a continuation higher. A move below 146.5 wouldshow some weakness, but I am marking key support at 145 and will notturn short-term bearish until the gap is filled.
Position: No position. The marketis showing too much resilience to justify top picking right now, but Iam also wary of long positions as the market gets overbought andbreadth deteriorates.
***Russell 2000 iShares (IWM)***
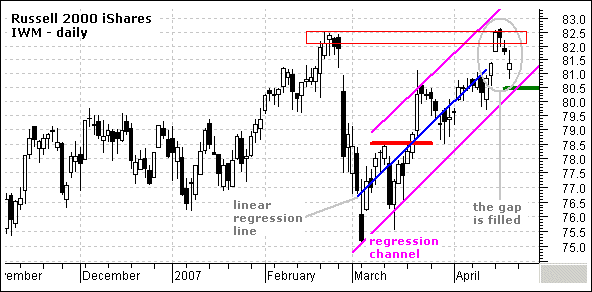
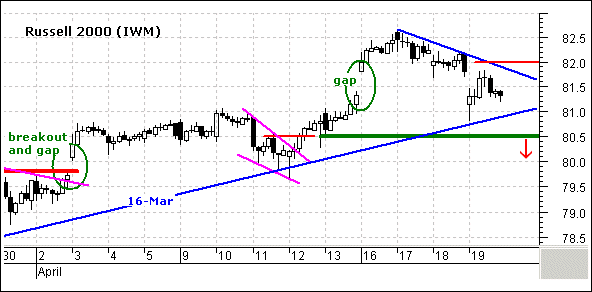
IWM remains in an uptrend, but the ETFfilled Monday’s gap and has been relatively weak the last three days.The rising price channel captures the uptrend and the ETF is tradingjust above the upper trendline. A spinning top candlestick formedyesterday and these denote indecision. This candlestick also confirmssupport around 80.5-81 and I will wait for a break below 80.5 to turnbearish on the daily chart. On the 60 minute chart, IWM moved lower thelast three days and I am watching resistance at 82 for a breakout. Thedeclines does not look like a classic falling flag, but it doesresemble a falling consolidation and a breakout at 82 would signal acontinuation higher. This would fill the yesterday’s gap and reinforcesupport around 80.5-81.
Position: Short from 81.9 on18-Apr. The two attempts to short QQQQ failed and the one attempt toshort IWM is succeeding so far. I am quite amazed a relative weaknessover the last three days and will keep this short position with astop-loss just above the breakeven point (82.1).
***Chart Setups***
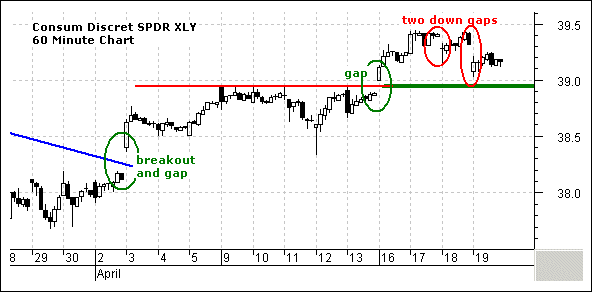
~XLY Gaps Down~ The ConsumerDiscretionary SPDR (XLY) gapped down for the second day running andstayed down yesterday. There was no recovery and the gap remainsunfilled. The ETF has support around 38.9 from broken resistance andthe 16-Apr gap. A move below this level would negate Monday’s breakoutand signal a continuation lower. The Consumer Discretionary is the mosteconomically sensitive sector and relative weakness would bode ill forthe market as a whole.
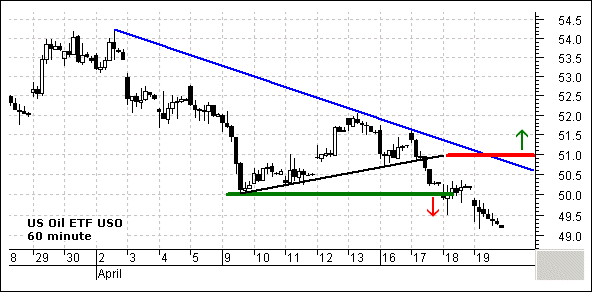
~USO Remains Weak~ The U.S. OilFund ETF (USO) broke support at 50 on Wednesday and continued lower onThursday. I find this break short-term bearish and I am marking keyresistance at 51. A move above this level would break the 2-Aprtrendline and negate this bearish signal.
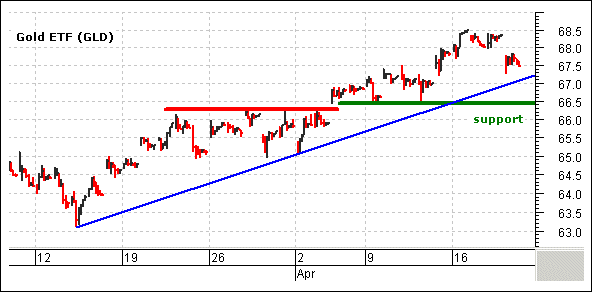
~GLD Gaps Down~ Gold gapped downfor the second time this week, but remains above the 14-Mar trendlineand key support at 66.5. The StreetTracks Gold ETF (GLD) can tradequite erratic and we need to allow room a correction within an uptrend.The ETF established support at 66.5 with two bounces last week and Iwill remain short-term bullish on bullion as long as this level holds.
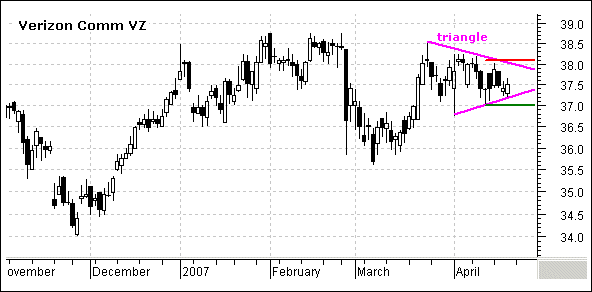
~VZ Forms Triangle~ Verizon (VZ)is part of the telecom group and the Telecom HOLDRS (TTH) has been atop performer over the last 18 months. The stock surged in the secondhalf of March and then consolidated with a triangle in April. The stockis showing some relative weakness over the last few weeks and did notfollow the S&P 500 to new highs this month. This is a concern, butI will still turn to the triangle for the next signal. A move to 38.1would break triangle resistance and signal a continuation higher. Myupside target would be the low 40s and I would set a stop-loss on abreak below 37 (36.8). Elsewhere in the group, Q moved higher on goodvolume yesterday.
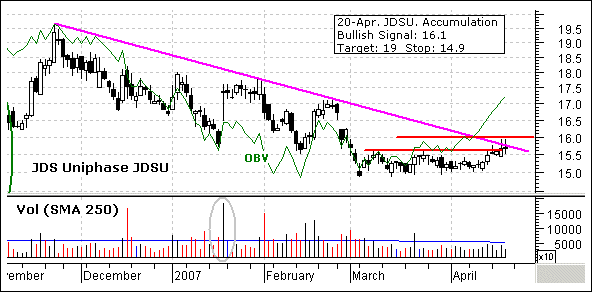
~JDSU Shows Signs of Accumulation~JDS Uniphase (JDSU) is a networking stock that has been down in thedumps the last few months, but shows signs of buying pressure the lastfew weeks. Even though the stock has been flat since early March, it isup 11 of the last 13 days and this includes the current eight day run.On Balance Volume is moving higher and shows steady buying pressure,despite low volume overall. The stock is meeting resistance from theNovember trendline and formed a doji yesterday. Further strength above16 would break the trendline and be bullish. I would target a move toaround 19 and set a stop on a break below 15.
Good day and good trading -Arthur Hill
---------------------------------------------------------------
Click here to post a comment, suggestion or question.
Breadth Charts ---------------------------------
---------------------------------------------------------------
Disclaimer: Arthur Hill is not a registered investment advisor. Theanalysis presented is not a solicitation to buy, avoid, sell or sellshort any security. Anyone using this analysis does so at his or herown risk. Arthur Hill and TD Trader assume no liability for the use ofthis analysis. There is no guarantee that the facts are accurate orthat the analysis presented will be correct. Past performance does notguarantee future performance. Arthur Hill may have positions in thesecurities analyzed and these may have been taken before or after theanalysis was present.
--------------------------------------------------------
about: The Daily Swing is posted every trading day around 6AM ET andfocuses on short-term strategies for QQQQ, SPY and IWM. In addition, attwo stock setups are featured every day with a detailed tradingstrategy. As warranted, coverage extends to broad market topics, keysectors and industry groups and inter-market securities (gold, bonds,the Dollar and oil).
--------------------------------------------------------
Sources: Data from Bloomberg.com, CBOT.com, Kitco.com and ino.com;Charting from Metastock (equis.com). Closing data from Reuters.com,eSignal.com, MS QuoteCenter and Yahoo! Finance.


