
***Position Summary***
Stocks continued lower on Thursday andthe short-term trends are now down for QQQQ and SPY. The short-termtrend for IWM is flat because the ETF is trading at support on the 60minute chart. These short-term downtrends are still within medium-termuptrends. QQQQ, SPY and IWM all reached new rally highs just this week.Yesterdays decline was sharp, but one day does not a trend changemake. Stocks were simply ripe for a pullback and a corrective phase maybe beginning. Corrections can take two forms: shallow pullback ortrading range. It is hard to say which type of correction will followand we could even get a little bit of both with a choppy decline. Theadvance from mid March to mid May was quite sharp and the bulls areunlikely to go quietly. This means we can expect buyers to step in onthe first pullback and some sort of top is likely to form before we geta medium-term bearish signal. Have a greatMemorial Day weekend!
***Technical Highlights***
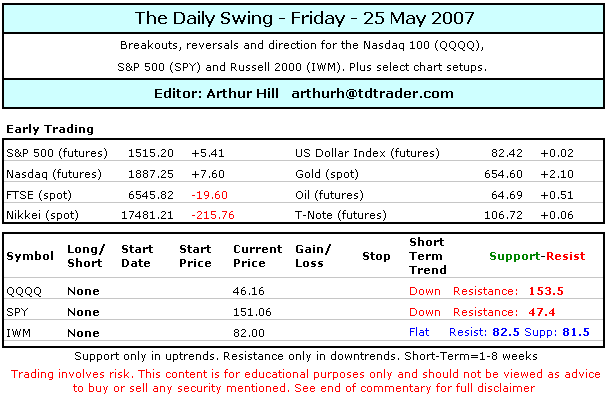
~The Follow Through Boo~ Greenspan spooked the markets onWednesday afternoon and stocks followed trough with further weakness onThursday. The Wednesday afternoon sell off paled in comparison toThursdays downside follow through. All of the major indices lostground with small-caps, mid-caps and techs leading the way lower. Thehigh-beta stocks took the beating and traders threw risk out thewindow. Volume surged to its highest level since 1-May and high volumeindicates that this was perhaps a little more than just profit taking.
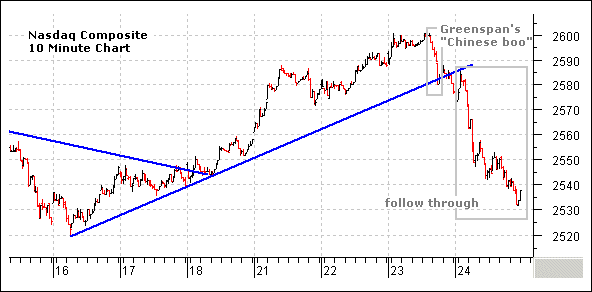
All nine sectors were lower and 93 of the100 Dow Jones Industry Groups were lower. Selling pressure was prettymuch across the broad and there was no place to hide. The Utility SPDR(XLU) was the biggest loser with a 2.24% loss and rising interestrates are taking their toll finally. Computer Disk Drives andComputer Hardware led the tech sector lower. The Software HOLDRS (SWH)was also weak with a gap down and decline to key support. Last weekstriangle breakout failed to hold and this key tech group is also introuble.
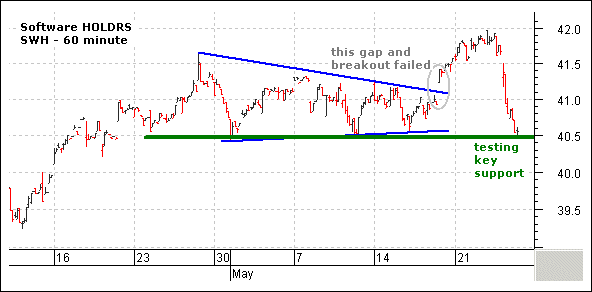
In the inter-market arena, oil and golddeclined, the US Dollar Index firmed with a small gain and bondsbounced in a flight to quality. The iShares ~20-year T-Bond Fund (TLT)formed a hammer yesterday and ended the day with a small gain. The ETFis still close enough to support that it just may hold and yesterdaysintraday dip could be a bear trap. Further weakness in stocks wouldlikely push more money towards bonds in a flight to quality. The hammeris the first sign of a reversal and I am looking for follow throughabove 87.3 to confirm.
***Nasdaq 100 ETF (QQQQ)***
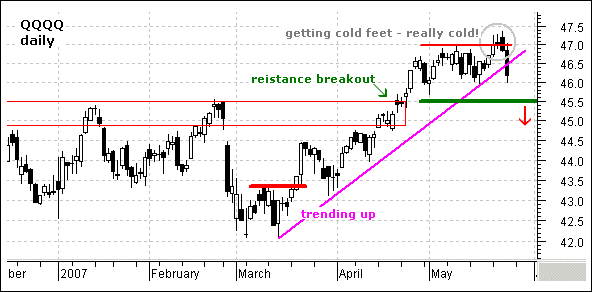
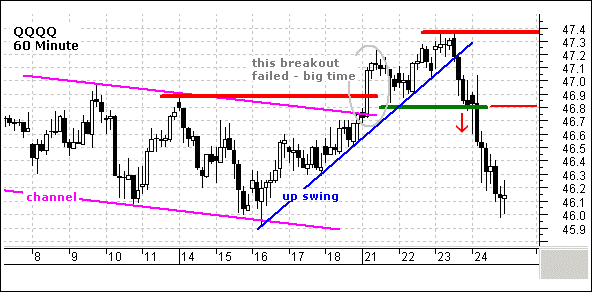
On the daily chart, QQQQ stall onTuesday, got cold feet on Wednesday and broke trendline support onThursday. This is the most weakness since late March and it looks likea correction or consolidation phase is starting. The ETF finished nearsupport at 46 and I am marking key support at 45.5. The trendline breakis negative, but it is only with one day weakness and I want to seefollow through below key support to call for a trend reversal on thedaily chart. On the 60 minute chart, QQQQ failed to hold Mondaysbreakout and declined sharply over the last day and a half. The movebroke key support at 46.8 to reverse the short-term upswing and thislevel turns into minor resistance. I am marking key resistance at 47.4for now and I will revisit this level next week.
Position: No Position. The ETF istrading near support and already short-term oversold, which means wemay see a bounce back towards broken support. A move back to around46.7, may provide a second chance for short positions.
***S&P 500 ETF (SPY)***
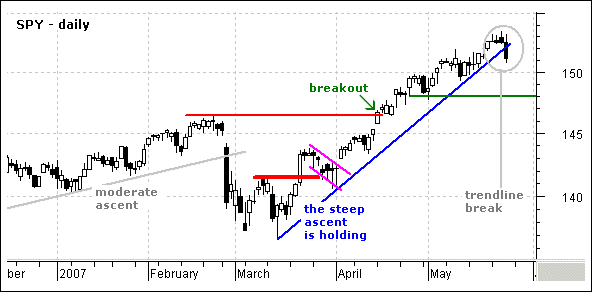
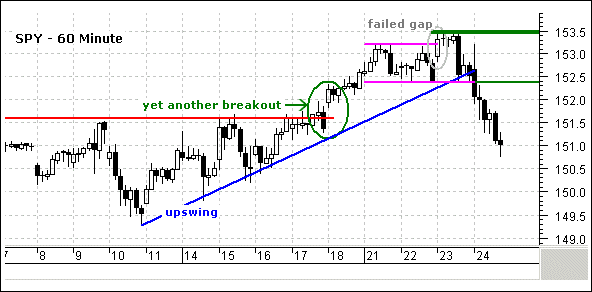
On the daily chart, SPY stalled forthree days and broke trendline support with a long black candlestickyesterday. Lets not read too much into this trendline break. The lineis quite steep and had to break sometime. In addition, the decline isjust one day and one day does not (usually) make for a medium-termtrend reversal. The ETF was clearly overbought and ripe for acorrection or consolidation. Typical corrections retrace 1/3 to 2/3 ofthe prior advance. This move was quite strong and the correction may beon the shallow side at least the first move. A 33% retracement wouldextend to around 148 and this is where we may see some support or abounce. On the 60 minute chart, SPY broke support at 152.3 with a sharpdecline and the short-term trend is down. The break follows a failedgap on Wednesday and the ETF also moved below last weeks breakout.Broken support turns into minor resistance and 152.3 is the first levelto watch. I am marking key resistance at 153.5 for now and will revisitthis level next week.
Position: No position. The ETF isalready short-term oversold and we may see a bounce back towards brokensupport. A move back to around 152.5 may provide a second chance forshort positions.
***Russell 2000 iShares (IWM)***
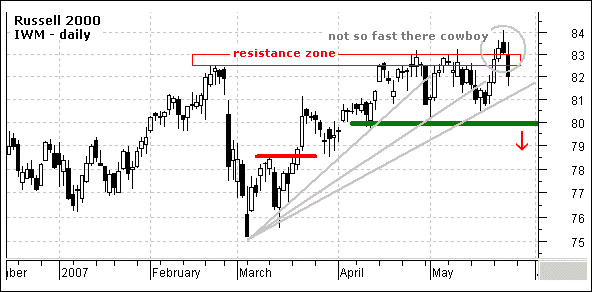
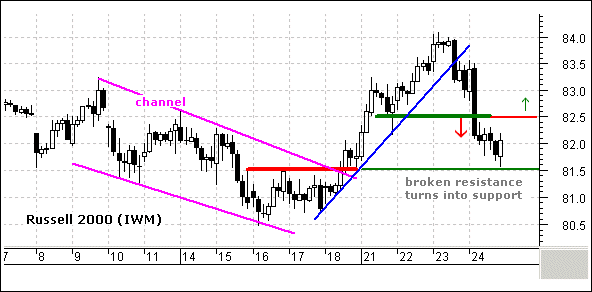
Now its broken. Now its not. IWM brokeresistance on Tuesday, pulled back on Wednesday and moved back belowthe breakout on Thursday. This is not encouraging stuff for the bulls.The overall trend remains up as IWM did forge a higher high. There is alot of support around 80-82 from the May lows and third fan line. Thisis where the ETF needs to firm in order to keep the medium-term uptrendalive. On the 60 minute chart, IWM broke the upswing trendline onWednesday and key support on Thursday to start a short-term downtrend.Most of the decline occurred in the first hour of trading and the ETFfirmed the rest of the day. IWM is finding support near brokenresistance and yesterdays decline may have been an overshoot,something IWM loves to do. Broken support at 82.5 turns into minorresistance and a move back above this level would be positive.
Position: No position. IWM is backin its trading range on the daily chart and near support on the 60minute chart. This makes for a tricky situation. The aggressive tradeis a long position on a break back above 82.5. I am going to adhere tothe failed breakout on the daily chart and remain sidelined.
***Chart Setups***
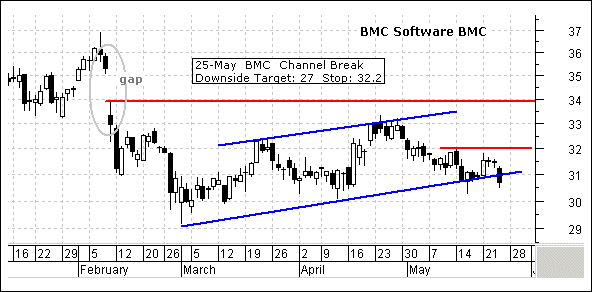
~BMC Shows Relative Weakness~ BMCSoftware (BMC) is in the application software business and competeswith Computer Associates (CA). The stock gapped down in February andcontinued lower into early March. A rebound followed over the last fewmonths, but the stock never made it back above the gap. The rally wasmuch weaker than that seen in SPY or QQQQ and the stock shows relativeweakness. BMC formed a rising channel over the last few months andbroke the lower trendline yesterday. I find this break bearish and amtargeting a decline to the September consolidation around 27. The stockestablished resistance at 32 over the last three weeks and a move abovethis level would negate the signal.
Good day and good trading -Arthur Hill
---------------------------------------------------------------
Click here to post a comment, suggestion or question.
Breadth Charts ---------------------------------
---------------------------------------------------------------
Disclaimer: Arthur Hill is not a registered investment advisor. Theanalysis presented is not a solicitation to buy, avoid, sell or sellshort any security. Anyone using this analysis does so at his or herown risk. Arthur Hill and TD Trader assume no liability for the use ofthis analysis. There is no guarantee that the facts are accurate orthat the analysis presented will be correct. Past performance does notguarantee future performance. Arthur Hill may have positions in thesecurities analyzed and these may have been taken before or after theanalysis was present.
--------------------------------------------------------
about: The Daily Swing is posted every trading day around 6AM ET andfocuses on short-term strategies for QQQQ, SPY and IWM. In addition, attwo stock setups are featured every day with a detailed tradingstrategy. As warranted, coverage extends to broad market topics, keysectors and industry groups and inter-market securities (gold, bonds,the Dollar and oil).
--------------------------------------------------------
Sources: Data from Bloomberg.com, CBOT.com, Kitco.com and ino.com;Charting from Metastock (equis.com). Closing data from Reuters.com,eSignal.com, MS QuoteCenter and Yahoo! Finance.


