***Position Summary***
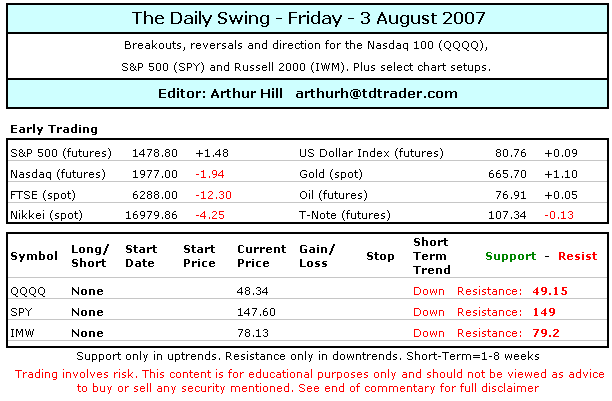
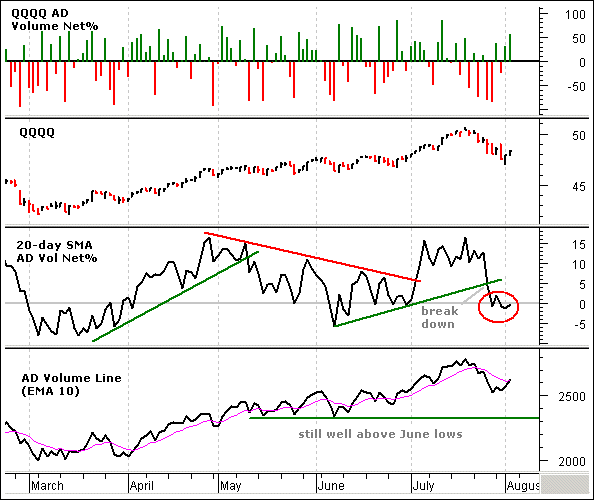
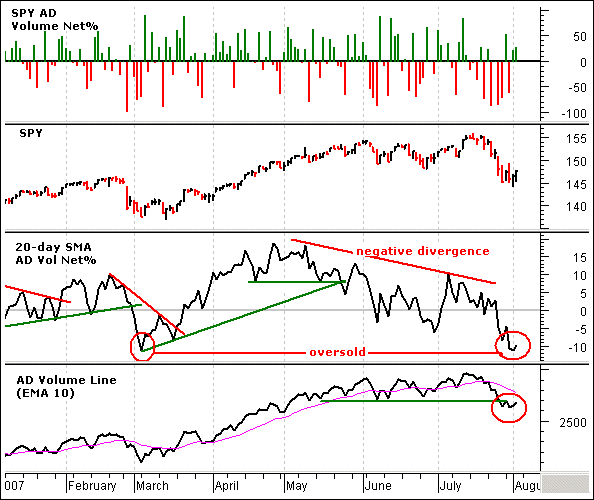
And now for the employment report. Ugh! As if things were not volatile enough, we have the monthly employment report due today. QQQQ, SPY and IWM became oversold last week and consolidated this week. The oversold nature of the market could produce a bounce on a positive employment report. Anything that meets or exceeds expectations would likely be viewed as positive. Interest rates have fallen sharply over the last few weeks and stock market investors are now looking for clues that the economy can weather the sub-prime fiasco. Whether or not this bounce or gap holds is an entirely different question. I showed the SPY charts from May 2006 and March 2007 in yesterday’s report. In both instances, SPY suffered a sharp decline, bounced and then tested the lows after the first bounce. The first bounce failed and this is why I am not going to buy on the first bounce. Instead, I am going to let this bounce go and judge the quality of the move. Even though the early bird gets the worm, the second mouse gets the cheese and I prefer to be a second mouse right now.
The stock setups page is updated on Tuesdays and Fridays. ***Click here***
***Technical Highlights***
~More Rebound~ Stocks continued their rebound yesterday and all the major indices finished in the plus column. The gains were modest with the Nasdaq 100 (+1.11%) and the S&P SmallCap Index (+.97%) leading the way higher. Large-cap techs led the way higher in the first half of July and have held up better during the downturn. Small-caps, on the other hand, lagged on the way up and led on the way down. I still favor large-cap techs over the other indices and believe the Nasdaqs will lead on any rebound.
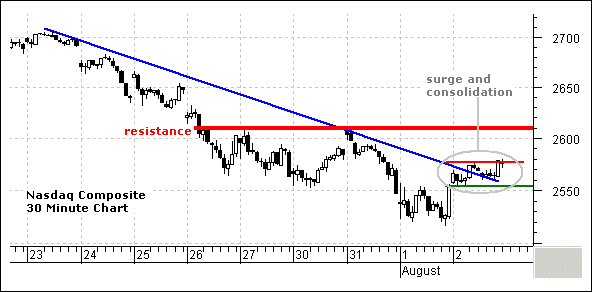
Eight of the nine sectors finished the day higher with Consumer Discretionary, Utilities and HealthCare leading the way. The Energy sector declined on the day as falling oil prices took their toll. 74 of the 100 Dow Jones Industry Groups were up with Homebuilders, Water Utilities and Toys leading the way. Paper, Coal and Oil led the way lower. The Consumer Discretionary SPDR (XLY) is finding support from the March lows and could get an oversold bounce. RSI moved below 30 (oversold) and the ETF firmed over the last four days. Broken support at 38.8 turns into resistance and this is the first upside target. I am not interested in playing such a bounce, but I would consider a short position on a move to around 38.5.
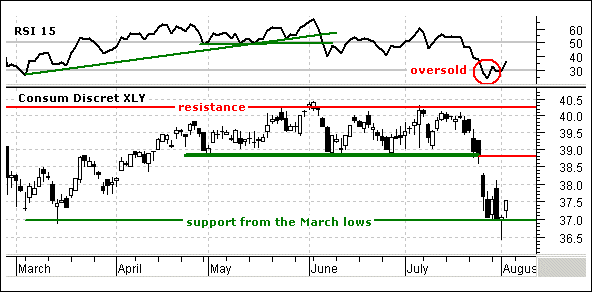
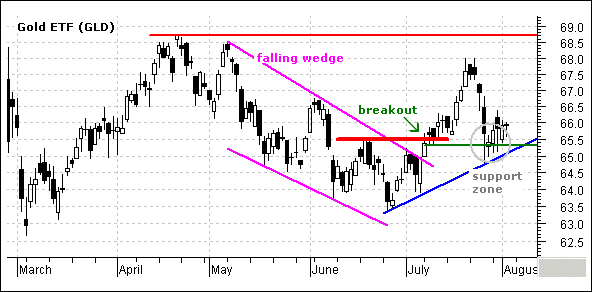
Inter-market action was quiet on Thursday. The US Dollar Index and oil edged lower while gold and bonds edged higher. The StreetTracks Gold ETF (GLD) continues to consolidated around 65.5 and hold its uptrend. The sharp decline at the end of July is viewed as a pullback (correction) as long as GLD holds above 65.3. A move below this level would call for trend reversal and test of the March-June lows. The US Dollar Index may hold the key to gold. The index surged last week and consolidated this week. Look for a break above 81.1 to continue last week’s rally. Such a breakout would likely weigh on gold and we could then see a breakdown.
***Nasdaq 100 ETF (QQQQ)***
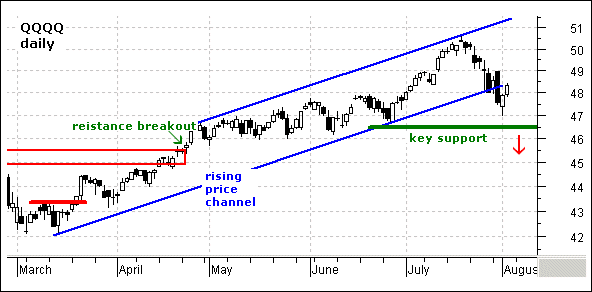
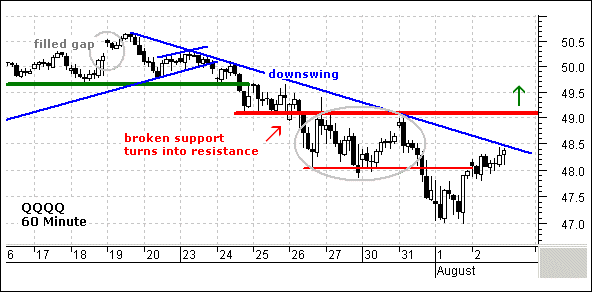
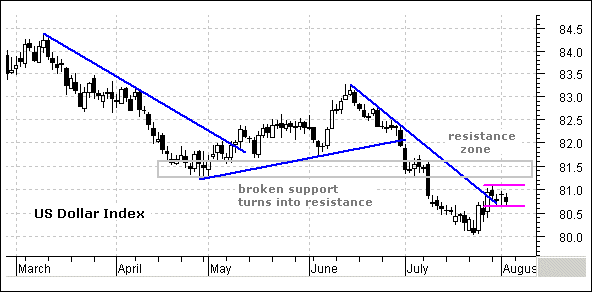
QQQQ bounced over the last two days and moved back above 48. Even though the ETF broke the lower trendline of the rising price channel, I remain medium-term bullish because QQQQ has yet to forge a lower low. Moreover, QQQQ forged a higher high in July and the medium-term trend is still up. Key support remains at 46.5 and it would take a break below this level to reverse the trend. On the 60 minute chart, QQQQ advanced to trendline resistance and entered the prior consolidation zone (gray oval). This area is now resistance and the going could get tough here. Key resistance remains at 49 and a break above this level would reverse the short-term downtrend.
Position: No position. Even though a break above 49 would be short-term bullish, I am not going to bite on the first breakout. After such a sharp decline, there is likely to be a retest of support and this would offer a better buying opp.
***S&P 500 ETF (SPY)***
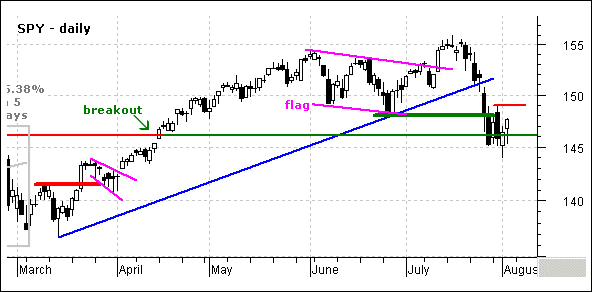
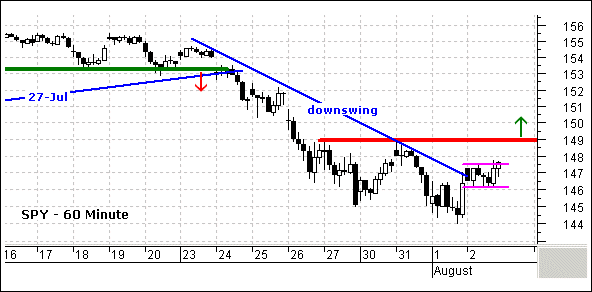
SPY bounced for the second day running, but has yet to surpass Tuesday’s high (long black candlestick). The bounces have been rather feeble and the ETF remains in a consolidation below the support break at 148. On the 60 minute chart, SPY surged late Wednesday and consolidated yesterday. The pattern looks like a flat flag (magenta lines) and the afternoon break above 147.5 is positive. However, this positive action is taking place below key resistance at 149 and from oversold conditions. As such, I consider this an oversold bounce and it would take a break above the 31-Aug high to reverse the short-term downtrend.
Position: No position. My stance is the same as that for QQQQ. Even though a break above 149 would be short-term bullish, I am not going to bite on the first breakout. After such a sharp decline, there is likely to be a retest of support and this would offer a better buying opp.
***Russell 2000 iShares (IWM)***
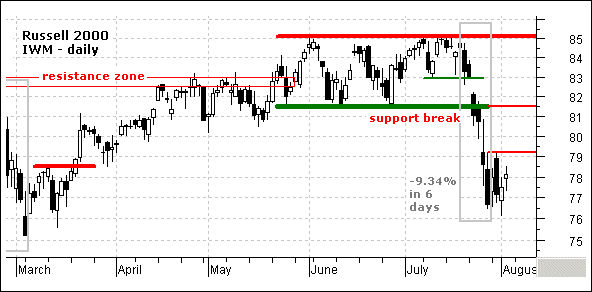
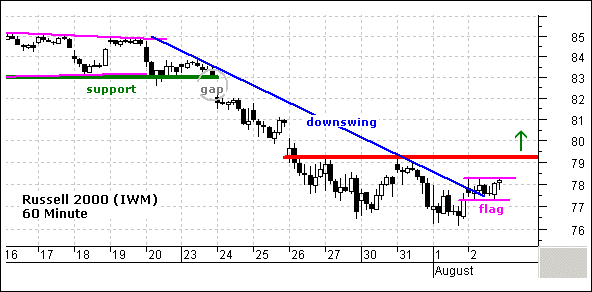
IWM became oversold after a 9.34% decline and the ETF has consolidated the last four days. IWM advanced three of the last four days, but these advances have been rather weak and the ETF remains below consolidation resistance at 79.2. A break above this level would argue for a corrective rally and the first target would be broken support around 81.5. A move below consolidation support at 76 would signal a continuation lower. On the 60 minute chart, IWM surged last Wednesday and then formed a flat flag on Thursday. A move above the flag high would be positive and a break above 79.2 would reverse the short-term downtrend.
Position: No position. My stance is the same as that for IWM. Even though a break above 79.2 would be short-term bullish, I am not going to bite on the first breakout. After such a sharp decline, there is likely to be a retest of support and this would offer a better buying opp.
***Chart Setups***
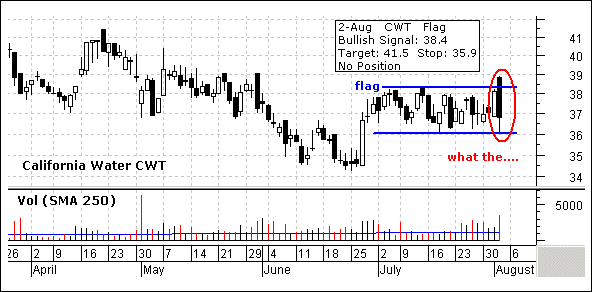
~CWT Says It All~ I am going back to the chart of California Water (CWT) to illustrate the current market environment. First, it is earnings season and CWT reported after the close on Wednesday. Second, the markets were hit hard in the second half of July and this only increases anxiety. CWT had a pretty good earnings report and the stock gapped up on the open Thursday. That gap was it as the stock promptly peaked and declined below 37 on heavy volume. I noticed the mixed volume message yesterday and this continues (high upside volume and high downside volume). A consolidation should have relatively low volume and low volatility. For a water utility, CWT has both high volume and high volatility within the consolidation. There must be something else out there that has investors on edge here. Support is holding at 36 for now and a break below this level would negate this setup. It is price action like this that keeps me largely on the sidelines. I see some setups out there, but will refrain until things quiet down. Other setups include CQB with a high volume bounce, RFMD as it continues to hold its breakout and SNWL as it forms a falling flag over the last six days.
Good day and good trading -Arthur Hill
---------------------------------------------------------------
Click here to post a comment, suggestion or question.
Breadth Charts ---------------------------------
---------------------------------------------------------------
Disclaimer: Arthur Hill is not a registered investment advisor. The analysis presented is not a solicitation to buy, avoid, sell or sell short any security. Anyone using this analysis does so at his or her own risk. Arthur Hill and TD Trader assume no liability for the use of this analysis. There is no guarantee that the facts are accurate or that the analysis presented will be correct. Past performance does not guarantee future performance. Arthur Hill may have positions in the securities analyzed and these may have been taken before or after the analysis was present.
--------------------------------------------------------
about: The Daily Swing is posted every trading day around 6AM ET and focuses on short-term strategies for QQQQ, SPY and IWM. In addition, at two stock setups are featured every day with a detailed trading strategy. As warranted, coverage extends to broad market topics, key sectors and industry groups and inter-market securities (gold, bonds, the Dollar and oil).
--------------------------------------------------------
Sources: Data from Bloomberg.com, CBOT.com, Kitco.com and ino.com; Charting from Metastock (equis.com). Closing data from Reuters.com, eSignal.com, MS QuoteCenter and Yahoo! Finance.


