***Position Summary***
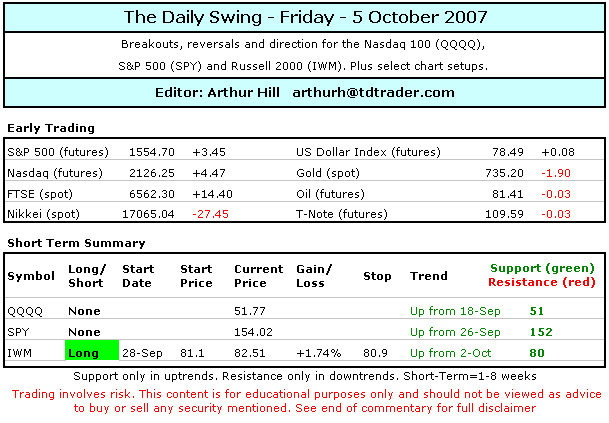
There is nothing to do now except wait for the employmentreport and Wall Street's reaction to this report. The medium-term trends for IWM, QQQQ andSPY remain up. The short-term trends are also up and all three formed flags over the lastthree days. On the 60-minute charts QQQQ and SPY formed falling flags while IWM formed aflat flag. These are bullish continuation patterns and a positive reaction to today's jobsreport will likely trigger some nice breakouts. The only play is on the gap and tradinggaps is dangerous, especially with IWM, QQQQ and SPY. These three tend to overreact on theinitial gap and it is hard to get a good risk-reward ratio. Look back to 17-Aug when allthree gapped up on the surprise rate cut and closed well below their initial gaps. Assuch, I will sit out these gaps and wait for the dust to settle.
The stock setups page is updated on Tuesdays and Fridays.***Click here***
***Technical Highlights***
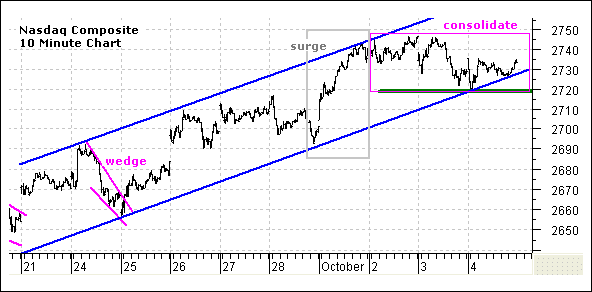
~Choppy Trading~ Stocks moved mostly higher onThursday, but trading was choppy as traders held out for the jobs report on Fridaymorning. The Dow Industrials ETF (DIA) and S&P 400 Midcap ETF (MDY) edged lower, whilethe Russell 2000 ETF (IWM) and Nasdaq 100 ETF (QQQQ) edged higher. Volume was belowaverage on both the NYSE and the Nasdaq. Seven sectors gained and two lost ground. Thegains and losses were minimal though. Gold and oil both opened weak, but rallied sharplyand closed strong. As a result, both the United States Oil Fund ETF (USO) and streetTRACKSGold ETF (GLD) formed bullish engulfing patterns at support (more on these two later). TheNasdaq 10-minute chart captures the three day consolidation quite well. The index surgedon Monday and traded flat the last three days. The index firmed near support from thechannel trendline and the uptrend is holding. Look for a move below 2720 to reverse thistrend.
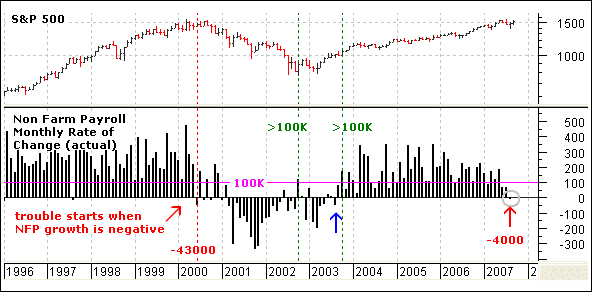
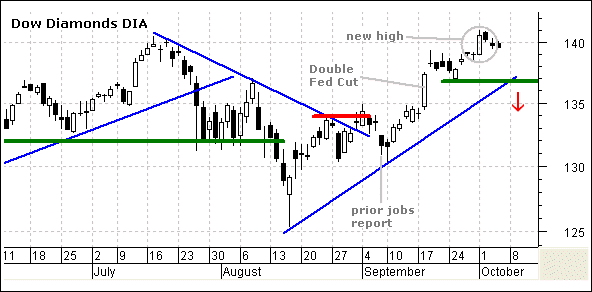
~Employment Report~ After last month's surprisedecline in Non-Farm Payrolls, the build up to this month's jobs report is quite big. Sincelast month's decline (-4000 on 7-Sept), the Dow Industrials ETF (DIA) is up over 6% andthe Nasdaq 100 ETF (QQQQ) is up over 7%. Stocks gapped down after the 7-Sept report, butfirmed the following Monday and started an 18 day rally that Tuesday. QQQQ moved above itsJuly high and DIA is challenging its July high. A whole lot of expectations are built intothe market after these advances. The consensus today is for 105,000 jobs to be created andthere are three possible scenarios: above consensus, below consensus and in-line. I thinkan in-line number or above consensus report would be bullish for stocks because this wouldalleviate recession fears. A below consensus number would be negative and the degreedepends on how far below. Another negative number would increase the chances of recessionand likely lead to a broad sell off. Consumer Discretionary and Retail stocks would thentake the biggest beating. These two are the most economically sensitive. More jobs meansmore money and more money translates into higher consumer spending.
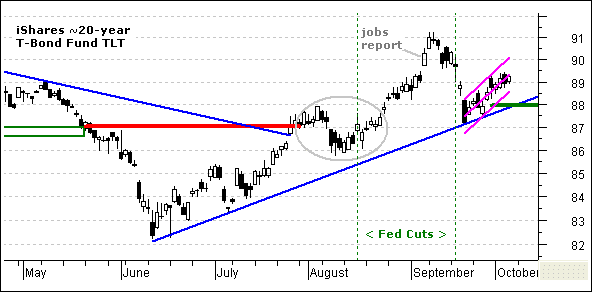
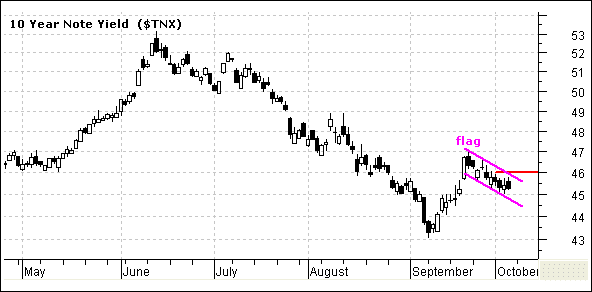
~iShares 20+ Year Bond ETF (TLT)~ Bonds areaffected probably more than stocks from the jobs report. The iShares 20+ Year Bond ETF(TLT) peaked just after the last report and declined to around 87 in mid September. TheETF was overbought around 91 and the decline to 87 alleviated these overbought conditions.TLT bounced over the last two weeks and the trend remains up. I am concerned because thisbounce looks like a bear flag (rising flag) and a move below 88 would signal acontinuation lower. The magenta lines form a Raff Regression channel that looks like aflag. A weak jobs report would increase the chances of another rate cut and spark a rallyin bonds. A strong report would seriously decrease the chances of another rate cut andbonds would fall sharply. The next chart shows the 10-Year Note Yield ($TNX), which movesinverse to the iShares 20+ Year Bond ETF (TLT). Rates rise as bonds fall and rates declineas bonds rise. TNX shows a bull flag in the making and a move above 46 (4.6%) would bebullish for rates.
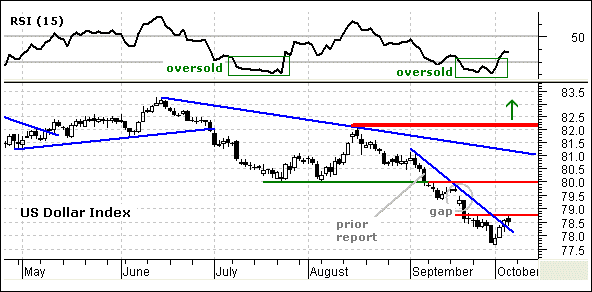
~U.S. Dollar Index ($USD)~ The affect of the jobsreport on the U.S. Dollar Index ($USD) is more complicated and the index declined sharplyafter last month's report. A weak jobs report points to lower interest rates and lowerinterest rates put downward pressure on the U.S. Dollar. Lower rates mean lower yields forTreasuries and this makes them less attractive. Notice how both the 10-Year Note Yield($TNX) and the U.S. Dollar Index ($USD) fell from June to September. Most recently, theU.S. Dollar Index became oversold and bounced over the last few days. However, this isjust a bear market bounce at this stage. A weak jobs report would put downward pressure onrates and the U.S. Dollar. A strong report would put upward pressure on rates and the U.S.Dollar. I see a resistance zone around 80 and this is the first target for any bounce.
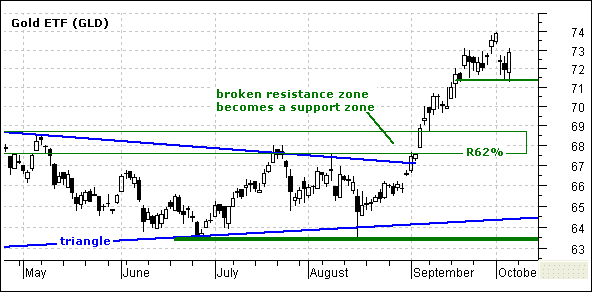
~streetTRACKS Gold ETF (GLD)~ Gold will likelymove opposite the U.S. Dollar. If rates and the U.S. Dollar surge, then gold will comeunder pressure. If rates and the U.S. Dollar fall, then gold will likely bounce. Lowerrates and a lower U.S. Dollar are inflationary and this will benefit gold. On the pricechart, GLD formed a bullish engulfing at support around 71.5. This reinforces support hereand a move below Thursday's low would be short-term bearish. This makes for a well-definedrisk point for new longs. A break below Thursday's low would target a deeper pullbacktowards the 68-70 region.
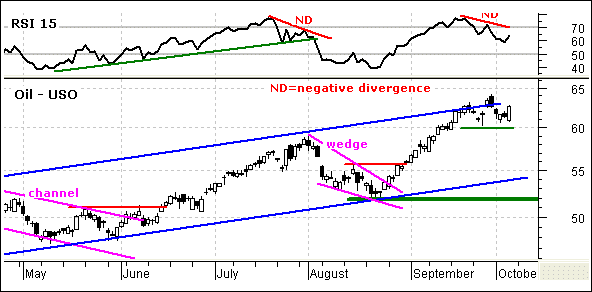
~United States Oil Fund ETF (USO)~ Gold and oilsurged from mid August to the end of September and there is a positive correlation here.Most likely, oil is leading gold because rising energy prices point to more inflation. USOstalled over the last few weeks and RSI formed a negative divergence. However, USO heldsupport at 60 and formed a bullish engulfing yesterday. This keeps the uptrend alive and abreak below 60 would argue for a deeper pullback. I will ignore the negative divergence inRSI as long as USO remains above 60. Even though the ETF looks overbought still, the oddsfavor higher prices because all trends are currently up.
***Nasdaq 100 ETF (QQQQ)***
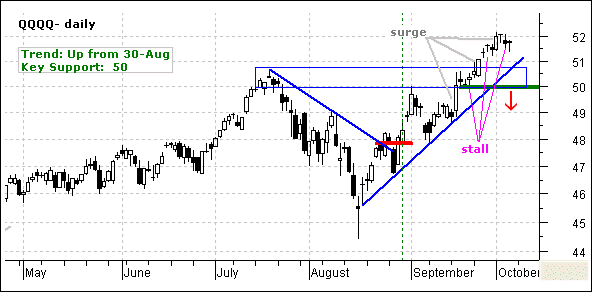
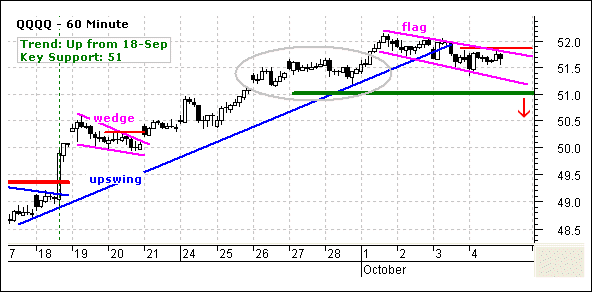
There is no change in the QQQQ analysis. On the dailychart, the ETF remains in an uptrend with surge and stall maneuvers under way. The ETFsurged on Monday and stalled on Tuesday-Wednesday-Thursday for the latest rendition. Theoverall trend remains up as long as the August trendline and key support at 50 hold.Broken resistance around 50-50.75 turns into support and this is the first area to lookfor firmness on any pullback. On the 60-minute chart, QQQQ formed a falling flag over thelast three days and a break above 51.9 would signal yet another continuation higher. Lastweek's consolidation (gray oval) marks a support zone around 51-51.5 and key support is at51. A break below this level would reverse the short-term uptrend and call for a deeperpullback.
Position: No current position.
***S&P 500 ETF (SPY)***
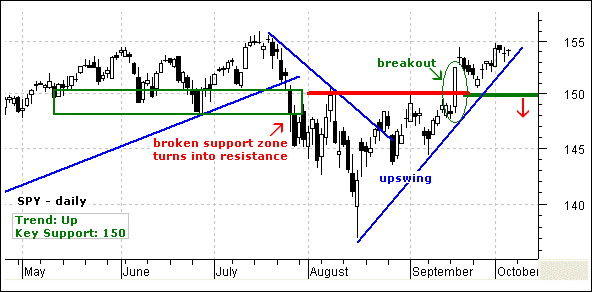
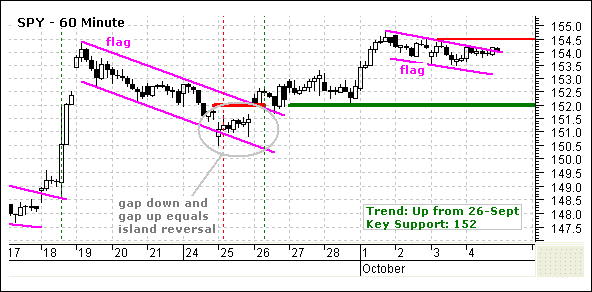
No change. SPY surged above 154 on Monday and thenstalled the next three days. There is considerable resistance around 155 from theJune-July highs, but the overall trend is clearly up. The breakout at 150 is holding andthis level turns into key support. A break below the August trendline would be negativeand a break below key support at 150 would reverse the uptrend. On the 60-minute chart,SPY corrected over the last three days and formed a falling flag. A break above 154.5would signal a continuation higher and project a break above the July high. I am raisingkey support to 152. This is based on broken resistance and the 27-28 lows. A break below152 would reverse the short-term uptrend and target another support test around 50.
Position: No current position.
***Russell 2000 iShares (IWM)*** disconcerting
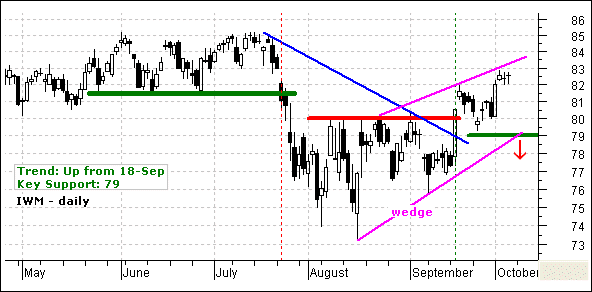
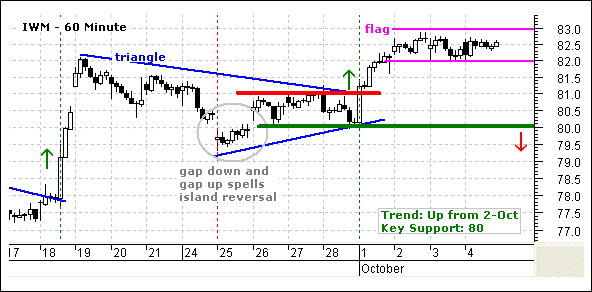
IWM surged on Monday and then stalled with two doji overthe last two days. The overall trend remains up as the ETF advances within a rising wedge.The breakout at 80 is holding and I am marking key support at 70. A move below this levelwould reverse the wedge (uptrend) and call for a continuation of the Jul-Aug decline. Onthe 60-minute chart, IWM traded flat the last three days while SPY and QQQQ declinedslightly. IWM has a flat flag while QQQQ and SPY have falling flags. IWM held up betterover the last few days and is showing some relative strength. A break above 83 wouldsignal a continuation higher and target a move towards the July highs around 85. A breakbelow flag support at 82 would be negative, but I am keeping key support at 80 for now.
Position: Long from 81.1 on 28-Sep. IMW held itsgains and I have a nice buffer heading into the jobs report. There is nothing to do nowexcept wait. I will keep the stop-loss at 80.9.
Good day and good trading -Arthur Hill
---------------------------------------------------------------
Click here to posta comment, suggestion or question.
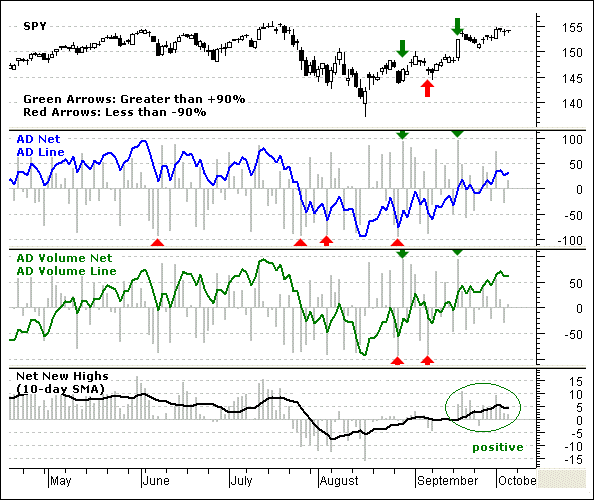
Breadth Charts ---------------------------------
---------------------------------------------------------------
Disclaimer: Arthur Hill is not a registered investment advisor. Theanalysis presented is not a solicitation to buy, avoid, sell or sell short any security.Anyone using this analysis does so at his or her own risk. Arthur Hill and TD Traderassume no liability for the use of this analysis. There is no guarantee that the facts areaccurate or that the analysis presented will be correct. Past performance does notguarantee future performance. Arthur Hill may have positions in the securities analyzedand these may have been taken before or after the analysis was present.
--------------------------------------------------------
about: The Daily Swing is posted every trading day around 6AM ET and focuses on short-termstrategies for QQQQ, SPY and IWM. In addition, at two stock setups are featured every daywith a detailed trading strategy. As warranted, coverage extends to broad market topics,key sectors and industry groups and inter-market securities (gold, bonds, the Dollar andoil).
--------------------------------------------------------
Sources: Data from Bloomberg.com, CBOT.com, Kitco.com and ino.com; Charting from Metastock(equis.com). Closing data from Reuters.com, eSignal.com, MS QuoteCenter and Yahoo!Finance.


