***Position Summary***
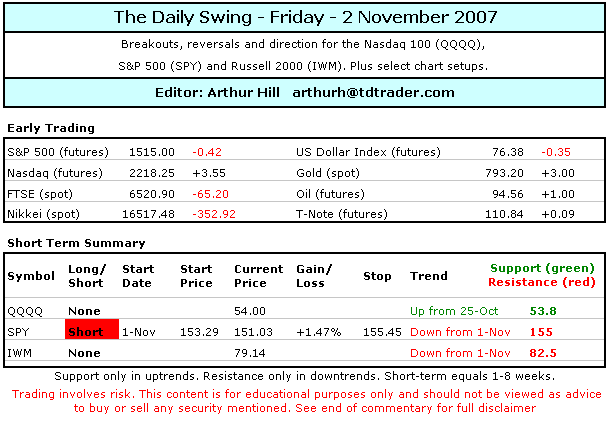
The stock market made another bearish statement yesterday and this is the second such statement in the last two weeks. The market tanked on 19-Oct with high volume, lopsided breadth (-90%) and relative weakness in small-caps. In yesterday's encore, we saw a big decline on high volume, AD Net% for SPY moved below –90% and small-caps led the way lower. In addition, the Finance and Consumer Discretionary sectors remain relatively weak and new lows are outpacing new highs. This is not a pretty picture.
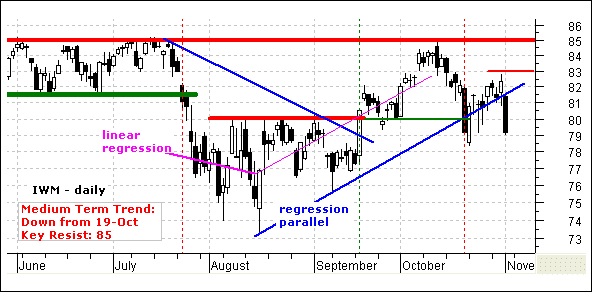
I turned medium-term bearish on SPY and IWM (19-Oct) and yesterday's decline reinforces this stance. The short-term trends for SPY and IWM are also down after yesterday's breakdown and it looks like we are seeing a continuation of the October declines. I went short SPY yesterday and will keep this position with a relatively tight stop.
The stock setups page is updated on Tuesdays and Fridays. ***Click here***
***Technical Highlights***
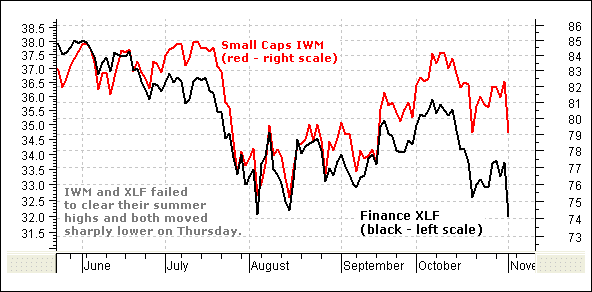
~Sea of Red~ Confusion over Fed policy gave way to selling pressure and all major index ETFs moved sharply lower. All were down over 2% and the Russell 2000 ETF (IWM) led the way lower with a whopping 3.86% loss. All nine sectors were lower with the Finance SPDR (XLF) leading the way down (-4.89%). There is a clear connection between small-caps and the finance sector. The Technology SPDR (XLK) held up the best with a 1.09% loss. Bonds surged in a flight to quality and the iShares 20+ Year Bond ETF (TLT) gained 1.31%.
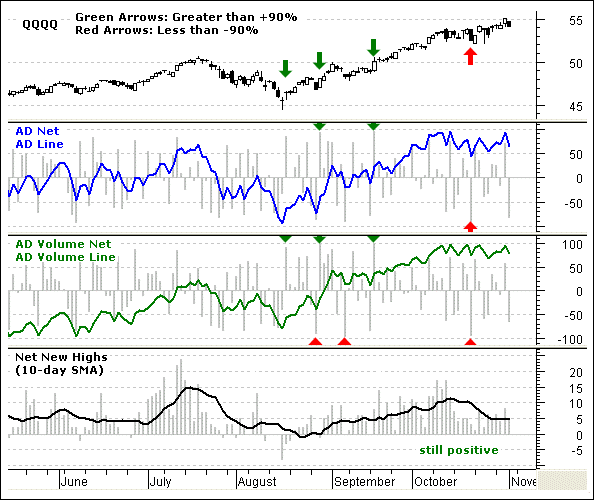
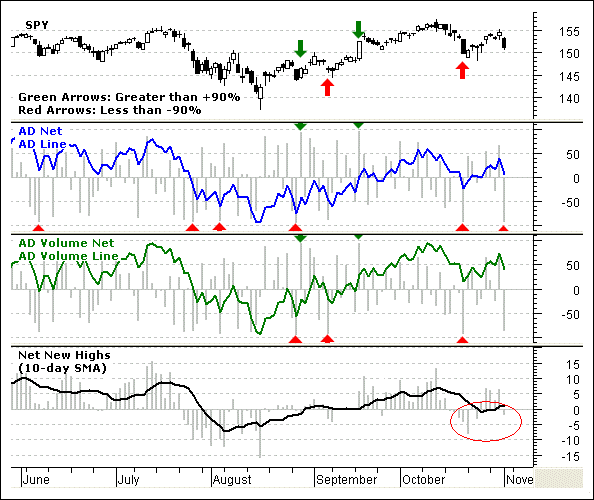
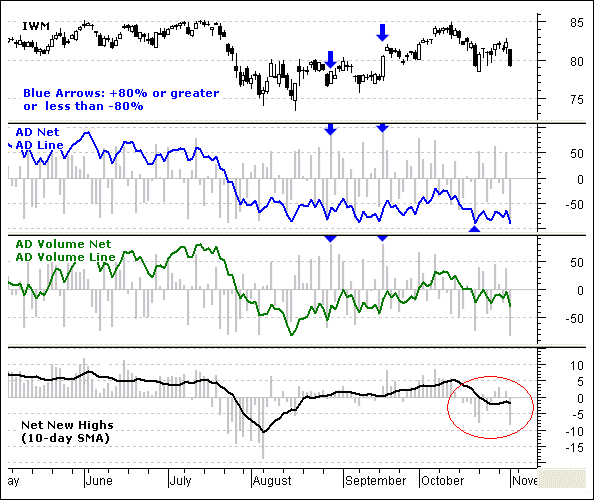
~Bearish Breadth~ The next three charts show the AD Line, AD Net%, AD Volume Line, AD Volume Net% and Net New Highs for the S&P 1500 ETF (ISI). I use this ETF for broad market breadth because it consist of small-caps (600), mid-caps (400) and large-caps (500). The AD Line reflects small and mid-cap performance. The AD Volume Line reflects large-cap performance and Net New Highs tilt the balance.
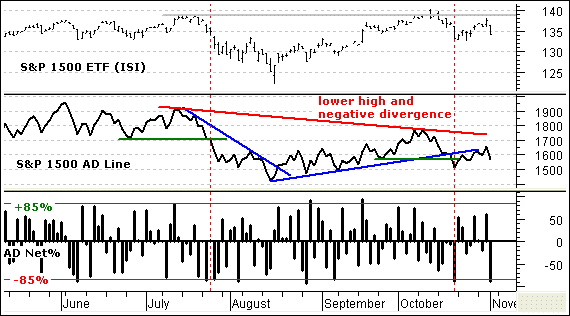
The AD Line formed a large negative divergence over the last four months and broke support in mid October (red dotted line). The negative divergence shows that small-caps and mid-caps were not keeping pace with the market (S&P 1500) from August to October. The breakdown over the last few weeks is bearish for breadth. Also notice that AD Net% moved below –85% twice in the last two weeks. This shows two very broad selling days.
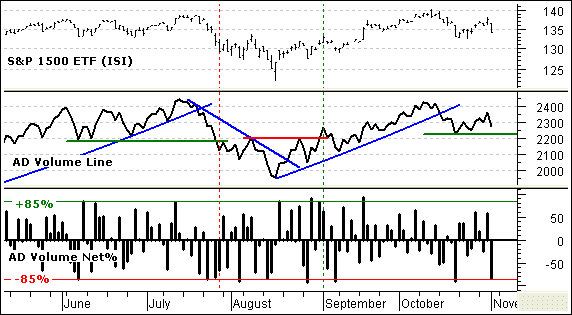
The AD Volume Line has kept pace with the underlying index and equaled its July high in October. After a sharp decline in mid October, the indicator bounced the last two weeks and I am watching support from the October low. A move below this level would be medium-term bearish for the AD Volume Line and would signal weakness in large-caps. This would be significant because large-caps have been holding the market up over the last few months.
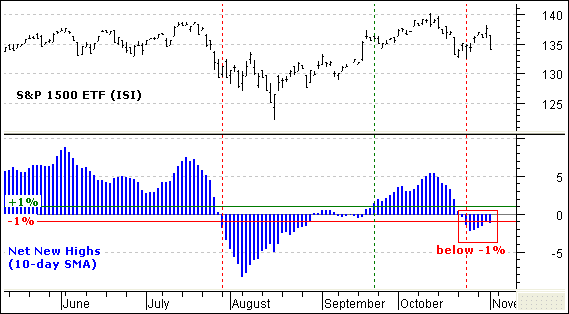
For Net New Highs, I apply a 10-day simple moving average to smooth the data series and prevent whipsaw signals. I also added +1% (green) and –1% lines (red). Crosses in positive territory are filtered with the +1% line and –1% line to decrease whipsaws. The indicator is bearish after a move below –1% and bullish after a move above +1%. New 52-week lows have been expanding and Net New Highs have been largely negative since 19-Oct. This pushed the 10-day SMA for Net New Highs below –1% and I consider this bearish. With the AD Line and Net New Highs indicator bearish, two of the three breadth indicators are bearish and the bears win this vote.
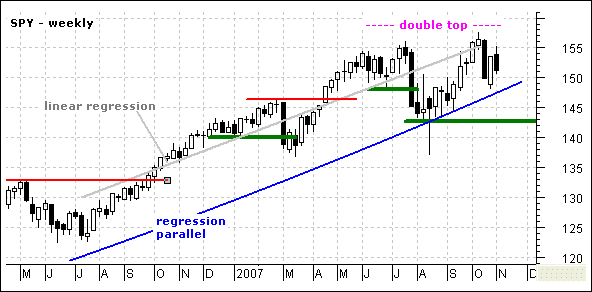
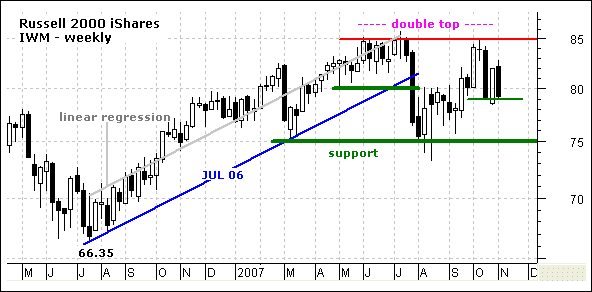
~Double Tops Looming~ Looking further out, large double tops are taking shape in IWM and SPY on the weekly charts. Both have reaction highs in July and October that are roughly equal. A move below key support would confirm these patterns and reverse long-term uptrends that have been in place for four years.
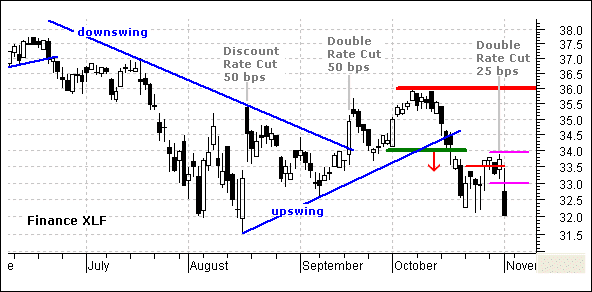
~Rate Cuts Not Helping~ I showed this chart yesterday and will show it again today. The Fed is trying to help the Finance sector, but the Finance SPDR (XLF) is NOT responding to rate cuts. The news (lower rates) is supposedly good and the reaction is bad (continued selling). You can lead a horse to water, but you can't make him drink. XLF gapped down yesterday and is poised to break its August low. This sector is leading the way lower and this is bearish for the broader market.
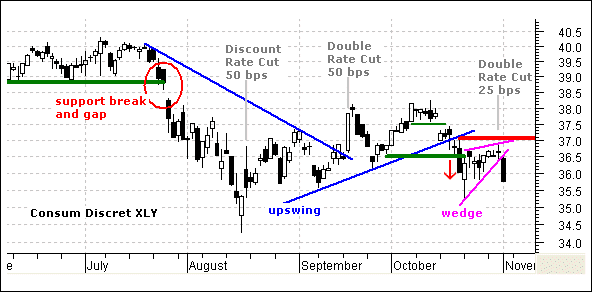
The second chart shows the Consumer Discretionary SPDR (XLY) and the rate cuts. This sector is also NOT responding to the Fed stimulus. XLY broke down in mid October and barely bounced after the breakdown. The ETF formed a tight rising wedge and broke wedge support with a long black candlestick yesterday.
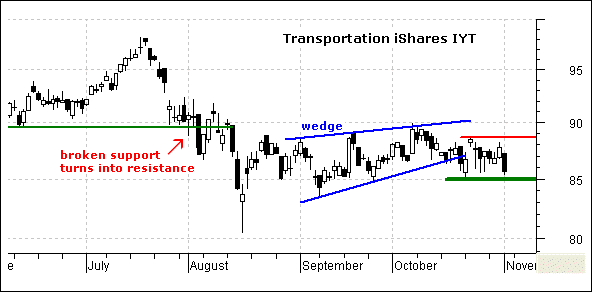
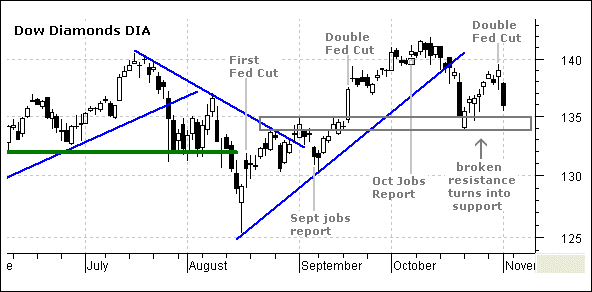
~IYT Could be Next~ Rising energy prices and a slowing economy spell double trouble for many of the transport stocks – especially trucking. The Transport iShares (IYT) broke down in August and then consolidated around 85-90 for two months. There was no real rally or significant buying pressure, just some flat trading to digest the break down. I am marking support at 85 and a break below this level would signal a continuation lower. It is also worth noting that IYT did not confirm the new high in DIA (October). This amounts to a Dow Theory non-confirmation and could lead to a Dow Theory sell signal in the coming weeks.
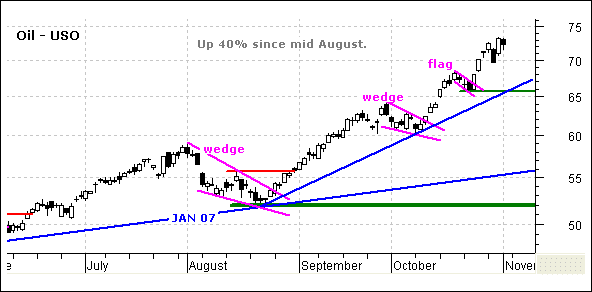
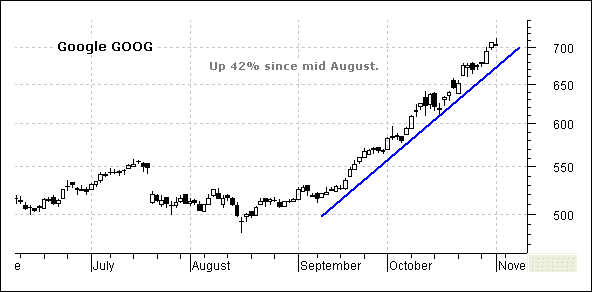
~Google Versus Oil~ While I do not think there is a connection here, there is no denying the price correlation over the last few months. Google (GOOG) and the United States Oil Fund ETF (USO) are both up around 40% since mid August and their advances look parabolic in nature (straight up). Google's advance is steeper and more prone to a sharp pullback. The United States Oil Fund ETF (USO) remains in a strong uptrend and is overbought. This is fine for holding longs with a profit buffer, but new positions risk a pullback and I would wait before considering a position. Let the market come to you. The August trendline and flag low mark support around 65-64 and this is where to expect support.
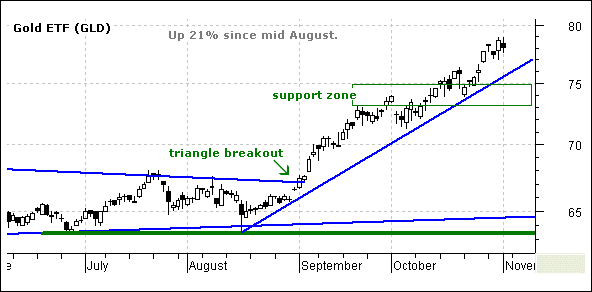
~Gold Versus Oil~ There is also a clear correlation between gold and oil. Moreover, this correlation makes sense and we should expect higher gold prices as long as oil moves higher. Even though trend is clearly up, the streetTRACKS Gold ETF (GLD) is also overbought and ripe for a pullback or consolidation. I am marking a support zone around 73-75 and this is the area to watch for a reaction low on any pullback.
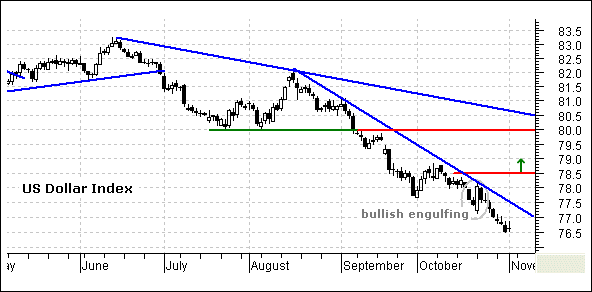
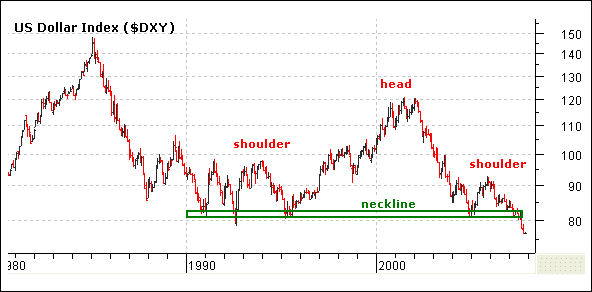
~U.S. Dollar Feeds the Fire~ The declining Dollar is keeping upward pressure on gold and oil. While there are some benefits to a declining Dollar, there are also negatives such as inflation and rising commodity costs. The U.S. Dollar Index ($USD) tried to firm with a bullish engulfing on 22-Oct, but there was zero follow through and the index moved to new lows yet again. The index is trading at historic lows with no end in site for this decline.
***Nasdaq 100 ETF (QQQQ)***
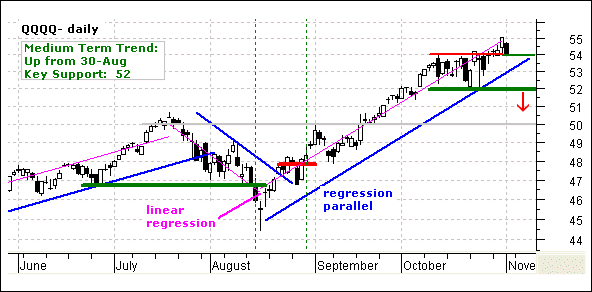
No change. QQQQ surged above 52, consolidated and broke consolidation resistance at 54. This breakout signals a continuation of the Aug-Oct advance. A strong breakout should hold and broken resistance at 54 turns into the first support test. A move back below 53.8 would be negative and a break below key support at 52 would be medium-term bearish. We recently saw a failed flag breakout in OIH and traders may want to study this pattern for clues.
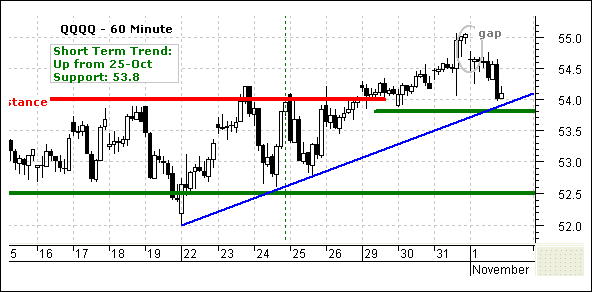
On the 60-minute chart, QQQQ gapped down and continued lower. The inability to recover after the gap is negative, but the ETF remains above broken resistance at 54 and the short-term trend is still up. As noted yesterday, I am marking key short-term support at 53.8. While a break below this level would be short-term bearish, it would be within the context of a medium-term uptrend and there is a ton of support around 52-53. In other words, I am not looking to short QQQQ on a short-term support break. Rather, I would just stay away for now.
Position: No current position.
Short-term Trend: Up from 25-Oct.
***S&P 500 ETF (SPY)***
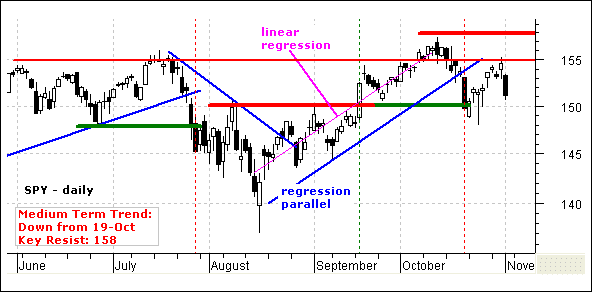
SPY broke down on 19-Oct and then bounced back to 155 with an eight day advance. That advance (short-term uptrend) ended with a long black candlestick yesterday and a lower high is taking shape. There is a ton of resistance around 155-158. This stems from the summer highs and the October high. Yesterday's decline marks a failure at resistance and I remain medium-term bearish. Minor resistance is now set at 155 and a close above this level would argue for a reassessment.
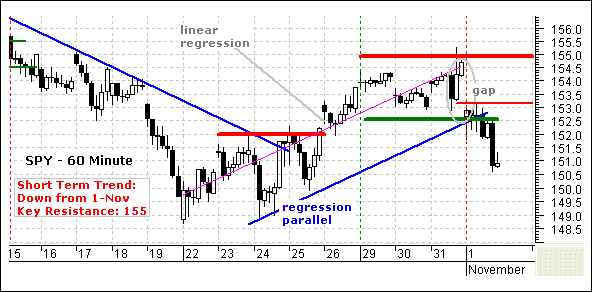
SPY gapped down for the second time this week and broke support at 152 with a sharp decline. This move broke the regression parallel and reversed the short-term uptrend. The breakdown calls for a continuation of the prior decline and targets further weakness below the October low. The gap and broken support become resistance and this is the first area to watch for signs of strength (minor resistance at 153). A move back above 153 would be quite positive. For now, I am setting key resistance at 155.
Position: Short from 153.29 on 1-Nov. I am setting my stop-loss at 153.6.
Short-term Trend: Down. SPY broke support at 152.5 and to start a short-term downtrend on 1-Nov.
***Russell 2000 iShares (IWM)***
IWM never made it above its July high and showed relative weakness in October. The ETF then broke down in mid October to start a medium-term downtrend on 19-Oct (red dotted line). Even though IWM bounced back above the regression parallel with a move to 83, the rally failed with yesterday's long black candlestick and the bears are back in control. A lower high formed at 83 and I can now mark minor resistance at 83. A move above this level would call for a reassessment of my bearish stance. Key resistance remains at 85.
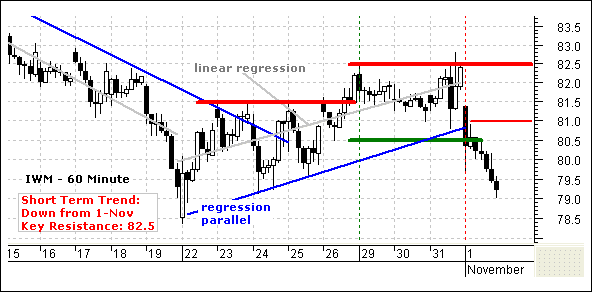
IWM broke short-term support with a gap down and the short-term trend is now down. The rally back to 82.5 retraced 62% of the prior decline (85 to 74) and the ETF met resistance at 82.5 twice last week. Thursday's gap down and support break signal a continuation of the prior decline and target a move below the October low. Broken support turned into resistance at 81 and this is the first level to watch for signs of strength. Key resistance is set at 82.5.
Position: No position.
Short-term Trend: Down. IWM broke support at 80.5 and to start a short-term downtrend on 1-Nov.
Good day and good trading -Arthur Hill
---------------------------------------------------------------
Click here to post a comment, suggestion or question.
Breadth Charts ---------------------------------
---------------------------------------------------------------
Disclaimer: Arthur Hill is not a registered investment advisor. The analysis presented is not a solicitation to buy, avoid, sell or sell short any security. Anyone using this analysis does so at his or her own risk. Arthur Hill and TD Trader assume no liability for the use of this analysis. There is no guarantee that the facts are accurate or that the analysis presented will be correct. Past performance does not guarantee future performance. Arthur Hill may have positions in the securities analyzed and these may have been taken before or after the analysis was present.
--------------------------------------------------------
about: The Daily Swing is posted every trading day around 6AM ET and focuses on short-term strategies for QQQQ, SPY and IWM. In addition, at two stock setups are featured every day with a detailed trading strategy. As warranted, coverage extends to broad market topics, key sectors and industry groups and inter-market securities (gold, bonds, the Dollar and oil).
--------------------------------------------------------
Sources: Data from Bloomberg.com, CBOT.com, Kitco.com and ino.com; Charting from Metastock (equis.com). Closing data from Reuters.com, eSignal.com, MS QuoteCenter and Yahoo! Finance.


