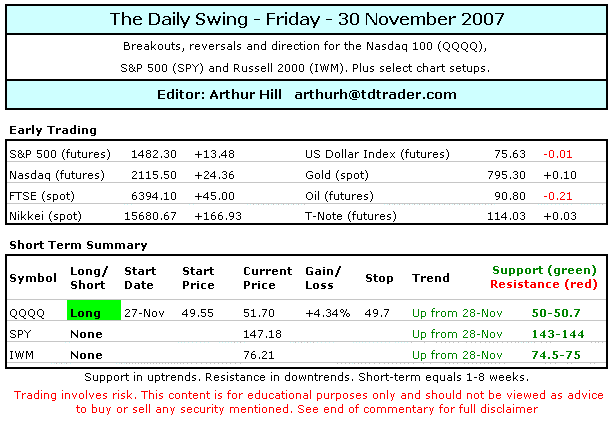
***Position Summary***
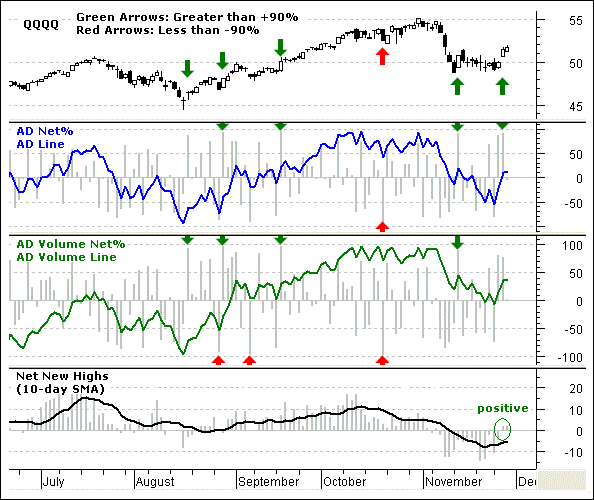
Fed chairman Bernanke hinted at lower interest rates in his speech last night and the futures are pointing to another strong open. While I have my doubts that lower interest rates can cure current ills, there is no sense fighting the Fed AND the tape. We saw big moves on big breadth Wednesday and these gains are holding. Even though financials and small-caps are more oversold and have more ground to recovery, I think QQQQ has a much strong chart. QQQQ held above its August low and already broke its 14-November high. SPY, DIA and IWM cannot make this claim. I remain long QQQQ and will take it one day at a time. There are no signs of weakness yet.
Friday's Fed speakers and market moving events: NAPM Chicago (9:45AM), Construction Spending (10AM), William Poole, Charles Plosser and Randall Kroszner speak.
I will post another report later today and look at the long-term situation of the major index ETFs. This report will include updates on gold, oil, bonds and the U.S. Dollar Index ($USD). The stock setups page is updated on Tuesdays and Fridays. ***Click here***
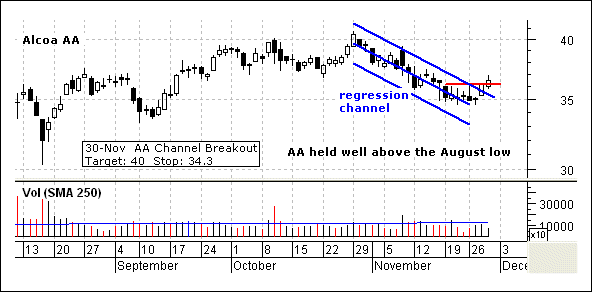
***Channel Breakout for AA*** Alcoa (AA) is part of the Aluminum industry group and the Materials sector. The Materials SPDR (XLB) remains well above its August low and surged on Wednesday. AA also remains above its August low and starting firming on 20-Nov. The stock stalled for five days and then broke above the upper channel trendline over the last two days. Volume could have been higher, but risk is well defined with a move below 34.5. I will add AA to the Stock Setups Portfolio between 36.55 and 36.7. The target first target is around 40 and the stop-loss will be set at 34.3.
***Nasdaq 100 ETF (QQQQ)***
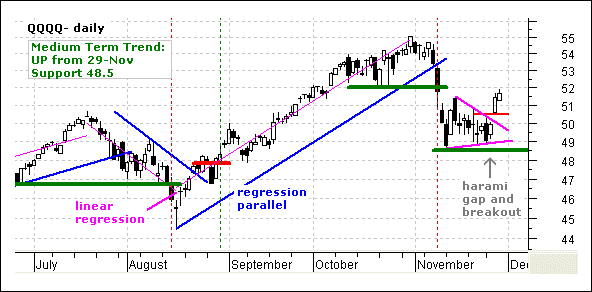
No change. After firming for two weeks, QQQQ surged above resistance with a gap and strong move. This gap should be treated as a breakaway gap as long as it holds. Strong ETFs hold their gaps and a move below 50 would be cause for concern. I am setting key support at 48.5 and a break below this level would be medium-term bearish. The current setup looks similar to the March reversal and breakout. QQQQ declined for four days in November and 5 days in March. Both declines were sharp and short. The initial surge in March lasted 6 days (+5%) and the current surge is in its second day (+5.1%). Broken support at 52 turns into minor resistance and this is the first test.
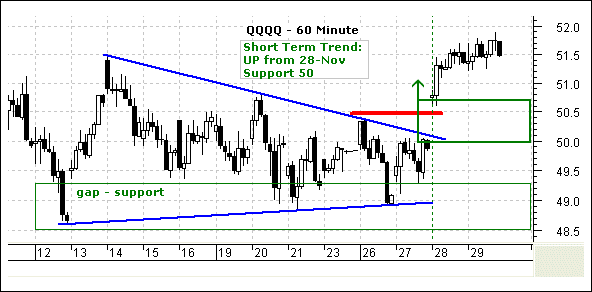
On the 60-minute chart, QQQQ gapped up on Wednesday morning and then worked its way higher. Even though upside was rather limited on Thursday, the gains are holding and buyers are keeping up the pressure. The gap and resistance breakout combine to mark a support zone around 50-50.7. This zone should hold on any pullback. A decline below 50 would break this support zone and call for a complete reassessment of Wednesday's breakout.
Short-term Trend: Up from 28-Nov (green dotted line).
Position: Long from 49.55 on 27-Nov. There are no signs of weakness here and my stop-loss remains at 49.7.
***S&P 500 ETF (SPY)***
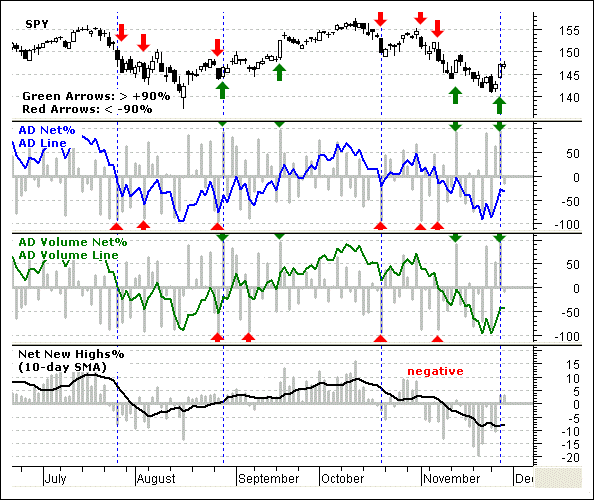
As mentioned yesterday, SPY remains below the regression parallel and has yet to reverse the medium-term downtrend. However, I have a bullish signal from AD Net% and AD Volume Net% (two 90% up days in two weeks). In addition, RSI broke its downtrend and closed above 50. I am looking for some follow through here because of relative weakness in the Finance and Consumer Discretionary sectors. Looking back to late August, you can see the break above the regression parallel and then a pullback (gray oval). I would not be surprised to see the ETF work its way higher the next few days and then start a pullback late next week.
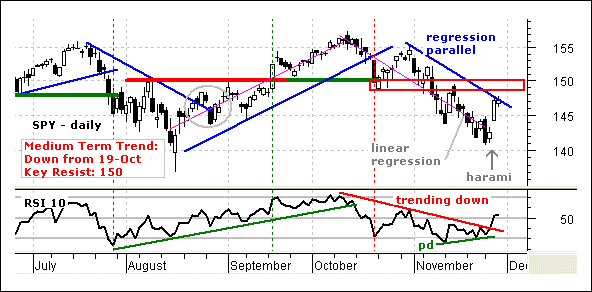
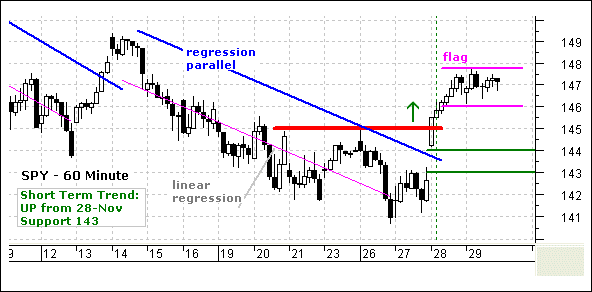
SPY gapped up and broke key resistance with a big surge on Wednesday. This was clearly a trend-reversing event (short-term trend that is). The ETF consolidated around 147 and formed a flat flag. A break above consolidation resistance would signal a continuation higher. Flag support at 146 is the first level to watch for signs of trouble. For now, key support remains at 143-144. The gap zone should hold and a move below 143 would be deemed too deep for just a pullback. At this point, I will wait for a pullback or better bullish setup to emerge before considering an entry.
Short-term Trend: Up from 28-Nov (green dotted line).
Position: No current position.
***Russell 2000 iShares (IWM)***
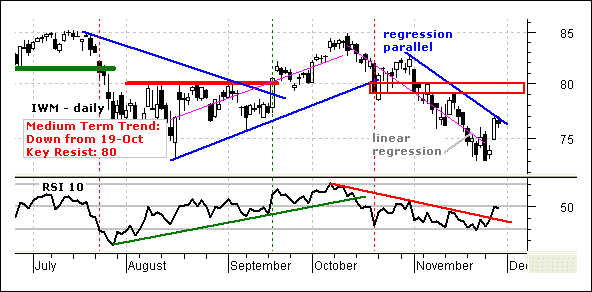
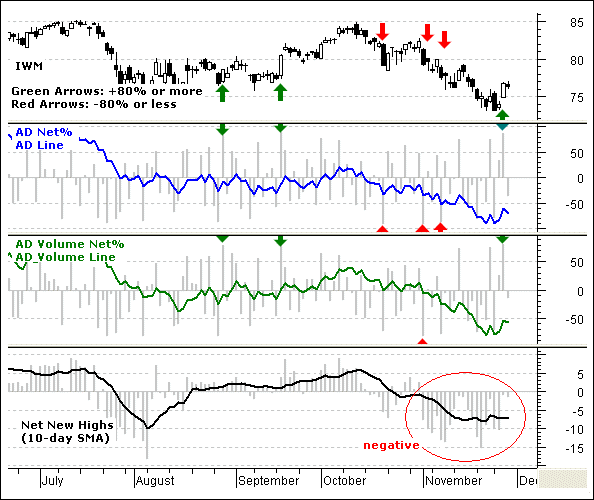
IWM formed a harami on Monday-Tuesday and surged on Wednesday. Like SPY, the move is short-term bullish, but the ETF remains in a medium-term downtrend. First, IWM is still below the regression parallel. Second, IWM forged a lower low on Monday and has yet to take out its prior high (14-Nov at 79.23. As with SPY, I am impressed with breadth, but I cannot label the trend as up until there is follow through and/or some sort of breakout.
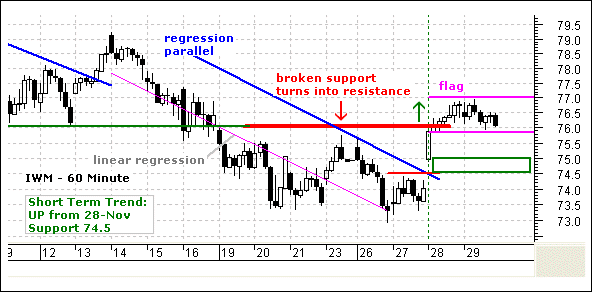
On the 60-minute chart, IWM gapped up and broke short-term resistance at 76. The gap and broken resistance combine to mark a support zone around 74.5-75.9. A strong breakout should hold and a move below 74.5 would call for a reassessment. At this point, the upside target is the resistance zone on the daily chart (78-80).
Short-term Trend: Up from 28-Nov (green dotted line).
Position: No position.
Good day and good trading -Arthur Hill
---------------------------------------------------------------
Click here to post a comment, suggestion or question.
Breadth Charts ---------------------------------
---------------------------------------------------------------
Disclaimer: Arthur Hill is not a registered investment advisor.The analysis presented is not a solicitation to buy, avoid, sell or sell short any security. Anyone using this analysis does so at his or her own risk. Arthur Hill and TD Trader assume no liability for the use of this analysis. There is no guarantee that the facts are accurate or that the analysis presented will be correct. Past performance does not guarantee future performance. Arthur Hill may have positions in the securities analyzed and these may have been taken before or after the analysis was present.
--------------------------------------------------------
about: The Daily Swing is posted every trading day around 6AM ET and focuses on short-term strategies for QQQQ, SPY and IWM. In addition, at two stock setups are featured every day with a detailed trading strategy. As warranted, coverage extends to broad market topics, key sectors and industry groups and inter-market securities (gold, bonds, the Dollar and oil).
--------------------------------------------------------
Sources: Data from Bloomberg.com, CBOT.com, Kitco.com and ino.com; Charting from Metastock (equis.com). Closing data from Reuters.com, eSignal.com, MS QuoteCenter and Yahoo! Finance.


