Hadik's chart...

Edited by Russ, 11 August 2017 - 11:34 PM.

Member
Posted 11 August 2017 - 11:31 PM
Hadik's chart...
Edited by Russ, 11 August 2017 - 11:34 PM.
Member

Posted 12 August 2017 - 03:42 AM
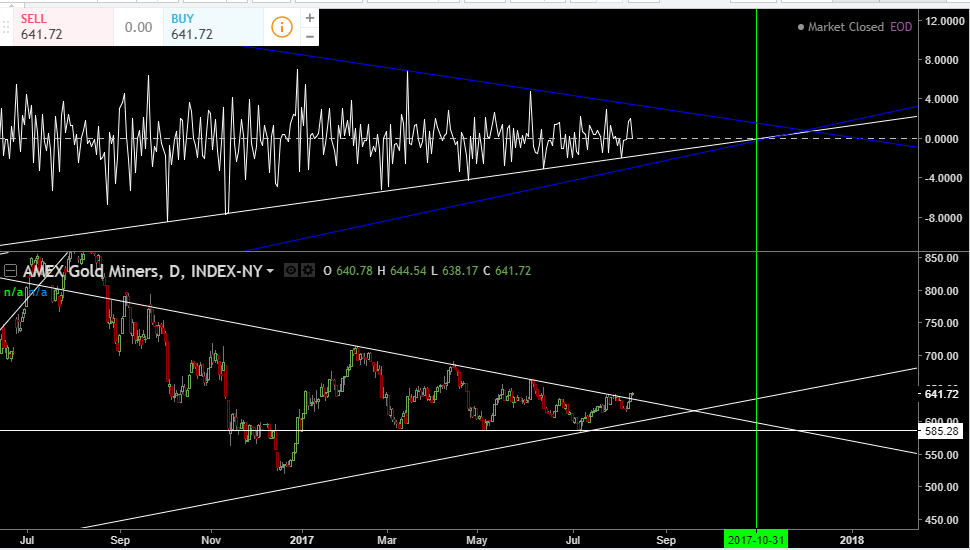
should that be 1 2 18 russ i dont see a date for a high on his chart what is your date for a top
Member
Posted 12 August 2017 - 07:18 AM
should that be 1 2 18 russ i dont see a date for a high on his chart what is your date for a top
The date at the bottom of Hadik's chart should be the date he created the chart, it is not clear exactly when his high will be but looks to be around the end of this years. My projections on multiple charts are all pointing to late Oct or early Nov. A tradestation chart may pinpoint it a little better but it should be close to this, notice how the oscillator is touching 5 points and almost 2, 4 points is considered confirmed, so this is a very strong chart, the upper part is already pointing at a Jan 2018 low on the weekly carried over onto the daily.
Edited by Russ, 12 August 2017 - 07:24 AM.


