Jump to content


Photo

Advance Decline Line Failure


  • Please log in to reply
28 replies to this topic

#11 Tor

Tor

    Member

  • Traders-Talk User
  • 7,647 posts

Posted 15 November 2009 - 04:04 AM

Below is a recap of the various A/D lines through Friday, showing that they failed to confirm the widely publicized big cap averages.

The top chart is the Dow Jones Industrial Average for reference, then NYSE composite, followed by the charts for the advance-decline lines for the New York Stock Exchange, the "total market", the S & P small cap index, and the Nasdaq for comparison. Note, importantly, their unanimous failure to confirm recent highs in the DJIA and SPX as those big cap averages made new highs. The charts are through Friday November 13, 2009, so you need to look at the latest data on the far right side of each chart in the top section.

If you look at the part of 2003 that was comparable to the current market situation, you'll see that as the DJIA and SPX made new high in late 2003, NYSE index and the A/D line for each sector confirmed. The current failure is potentially a hugely significant event, imo, and when it occurred finally in 2004, we were at the very top of the run and starting a correction that lasted more than half a year. Another important flag - and perhaps the correction is already underway.

DJIA

failure

failure

failure

failure

failure

Notice, importantly, that the NYSE and these A/D lines NEVER failed to confirm on ANY rally peak in 2003 after the March 2003 low- and that when this failure finally showed up in March 2004, we were then in the early stages of a correction that lasted August 2004.

NewHighs

Confirmed

Confirmed

Confirmed

Confirmed

Confirmed


Trend is UP IYB, It is unequivocably UP. Many have been fighiting this trend, you including. But the trend is UP. No lines have been crossed to the downside yet. Sure brreadth etc indicate some weakness, but the trend is UP. Stock a moving average in there ans us that.
Observer

The future is 90% present and 10% vision.

#12 porsche911sg

porsche911sg

    Member

  • Traders-Talk User
  • 2,907 posts

Posted 15 November 2009 - 05:18 AM

SS, Everthing done by hand, No computer charts they too infexible at turns, this is the dead give away I hand draw the charts so I can match up to the what ever rally present. At this point everthing is indicating a SELL. Feels like the 2002 -2003 period or 2004 correction period. I posted a pcture in my last post.
The market catches almost everyone on the wrong side. We always seem to get fake break out before that huge dump or the hugh dump before the false break down! Trade Safe!

#13 NAV

NAV

    Member

  • Traders-Talk User
  • 16,087 posts

Posted 15 November 2009 - 08:06 AM

So far, I just think the non-confirmation can exist as the price goes higher. It's something to keep an eye on but doesn't necessarily indicate exit for longs or entry for shorts.

SS


SS,

It's hard to trade with such a view. Those kind of statements belong to newsletter writers. If you beleive that higher prices can come with divergences, you should just yawn at what's happening and continue to hold longs. Are you hanging on to your longs ?

IYB,

Emerging markets like India and China failed to make new recovery highs. Something to add to your list of divergences.

"It's not the knowing that is difficult, but the doing"


https://twitter.com/Trader_NAV


#14 CLK

CLK

    Member

  • Traders-Talk User
  • 10,787 posts

Posted 15 November 2009 - 08:09 AM

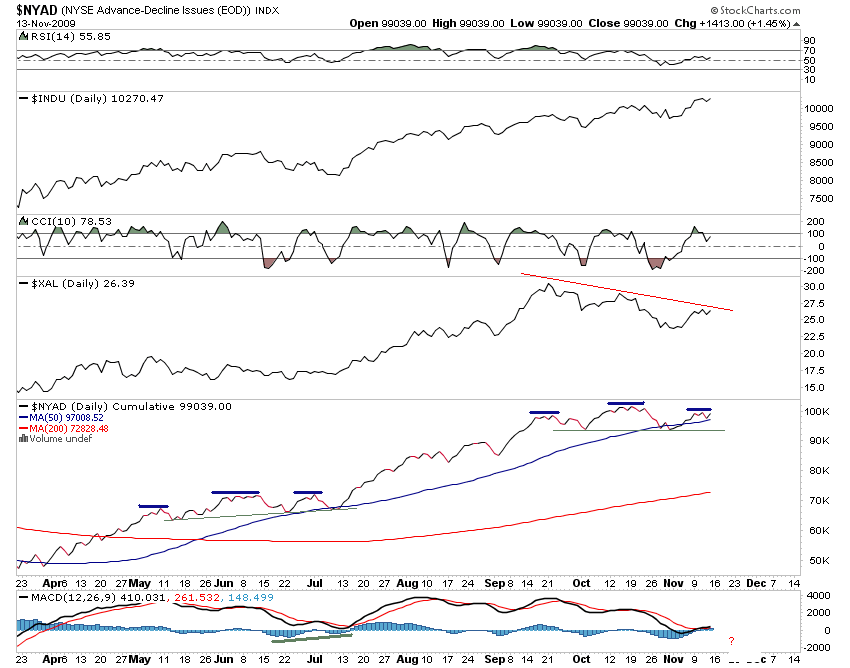
The A/D divergence means alot to me, I don't see how it could fail to produce lower prices, at least for the next couple weeks. What we have here is a H&S top for NYAD like we had in June, with the next low testing the neckline, that is most likely a buy once we get there, but maybe not, if price drops alot and fast. nyad_nov.png

#15 SuperSwing

SuperSwing

    Member

  • Traders-Talk User
  • 177 posts

Posted 15 November 2009 - 10:55 AM

You mean the images you posted with Nikkie a couple of days ago? I'll pull it out and take a look again.

But what you said about computer charting actually shocked me. I thought machines were able to detect more diminutive movements than humans. Very interesting! :)


SS, Everthing done by hand, No computer charts they too infexible at turns, this is the dead give away I hand draw the charts so I can match up to the what ever rally present. At this point everthing is indicating a SELL. Feels like the 2002 -2003 period or 2004 correction period.

I posted a pcture in my last post.


Patience is a virtue. Wait for your opportunity and pounce.

#16 SuperSwing

SuperSwing

    Member

  • Traders-Talk User
  • 177 posts

Posted 15 November 2009 - 11:07 AM

NAV,
No I don't have any longs right now. What I meant was not to use the non-confirmed divergence as the sole indicator. I think it's been happening with price going up for a while recently. I just get especially cautious when it happens. I either wait on the side or reduce my position size and get ready to get out.

SS


So far, I just think the non-confirmation can exist as the price goes higher. It's something to keep an eye on but doesn't necessarily indicate exit for longs or entry for shorts.

SS


SS,

It's hard to trade with such a view. Those kind of statements belong to newsletter writers. If you beleive that higher prices can come with divergences, you should just yawn at what's happening and continue to hold longs. Are you hanging on to your longs ?

IYB,

Emerging markets like India and China failed to make new recovery highs. Something to add to your list of divergences.


Patience is a virtue. Wait for your opportunity and pounce.

#17 goldswinger

goldswinger

    Member

  • Traders-Talk User
  • 2,612 posts

Posted 15 November 2009 - 01:35 PM

You mean the images you posted with Nikkie a couple of days ago? I'll pull it out and take a look again.

But what you said about computer charting actually shocked me. I thought machines were able to detect more diminutive movements than humans. Very interesting! :)


Porsche I am shocked too, A nice 5 MIN chart or 1 MIN if you like would help you a lot.....You are a great trader regardless!!!

GS.

#18 IndexTrader

IndexTrader

    Member

  • TT Patron+
  • 7,694 posts

Posted 15 November 2009 - 02:25 PM

So far, I just think the non-confirmation can exist as the price goes higher. It's something to keep an eye on but doesn't necessarily indicate exit for longs or entry for shorts.

SS


SS,

It's hard to trade with such a view. Those kind of statements belong to newsletter writers. If you beleive that higher prices can come with divergences, you should just yawn at what's happening and continue to hold longs. Are you hanging on to your longs ?


This kind of statement is accurate, whether it makes it "hard to trade" or not. There ARE various examples of A/D divergences where the major indexes went higher. It doesn't mean you HAVE to trade, or that you would YAWN and stay long. You could simply observe, wait for additional information. It also doesn't mean you have to short. You don't have to do anything until all the ducks line up, according to your own methodology.

IT

#19 IYB

IYB

    Member

  • TT Patron+
  • 7,145 posts

Posted 15 November 2009 - 04:47 PM

IYB,

Emerging markets like India and China failed to make new recovery highs. Something to add to your list of divergences.

Thanks NAV. I was just reading that on your blog. Also as was pointed out to me by PM from another member- the New Highs have dried up dramatically, down from 300 at Oct high to only about 115 (6 EMA) at this last weeks NEW high on the DJ and SPX. It's the classic case of fewer and fewer loggers carrying that log up the hillside. As more and more drop out, at some point the remaining loggers collapse from exhaustion, and the log rolls back down by itself.... :sweatingbullets:

Edited by IYB, 15 November 2009 - 04:48 PM.

“Men, it has been well said, think in herds; it will be seen that they go mad in herds, while they only recover their senses slowly, one by one.” Charles Mackay, Extraordinary Popular Delusions and the Madness of Crowds

#20 entre

entre

    Member

  • Traders-Talk User
  • 880 posts

Posted 15 November 2009 - 05:12 PM

Even though I'm not wavering in my this is all Fed-driven BS stance...the OEX p/c is not as high as I'd like to see it. In this type of market...if you can call it a market...it takes around two days in a row of that ratio around 2.0 or just below. In weaker markets the market might roll over on a single day closing oex p/c of around 1.5. If I were to be flexible I'd want to see at least one high oex p/c day...like 1.8 or 1.9.