Jump to content


Photo

Here We Go on the Advance/Decline Line Again


  • Please log in to reply
51 replies to this topic

#21 Echo

Echo

    Member

  • Traders-Talk User
  • 2,273 posts

Posted 28 February 2010 - 01:36 AM

And now for something totally different...
Yes, there are similarities between now and with the June-July 2009 pause in this recovery, but are we past the lows?
On July 1st, the AD line zoomed back up to its previous recovery high with the indexes stalling at about the .618 recovery eyeballing it. That did not prevent it from falling back down into the early July lower lows before taking off. Interesting fractal both for the NYAD and SPX.

http://stockcharts.com/c-sc/sc?s=$SPX&p=D&yr=0&mn=10&dy=0&i=p04679980425&a=72569959&r=7583.png

Full disclosure: The McOsc and McSum are behaving differently for the two time periods, but that is pure math on the AD line. I still think the fractals for the raw data (AD line) and SPX are intriguing.

Doc

Edited by Echo, 28 February 2010 - 01:45 AM.


#22 fib_1618

fib_1618

    Member

  • Traders-Talk User
  • 10,145 posts

Posted 28 February 2010 - 01:39 AM

Successive new highs on the cumulative A-D line (preferably running ahead of price) is a necessary but not sufficient condition for a sustainable market advance.

Given your point, what would be needed for a sufficient condition?

we have hundreds of derivative indicators like McO

Would you consider a moving average on a price chart a derivative of price?

I do use the AD Line as part of the analytical combo, but I use primarily my NASDAQ 100 AD Line.

Now I'm confused...why would you use something that has little or no analytical merit based on decimalization?

Even better...why would you use a portion of an A/D line of secondary (operating) issues that has been declining ever since its inception?

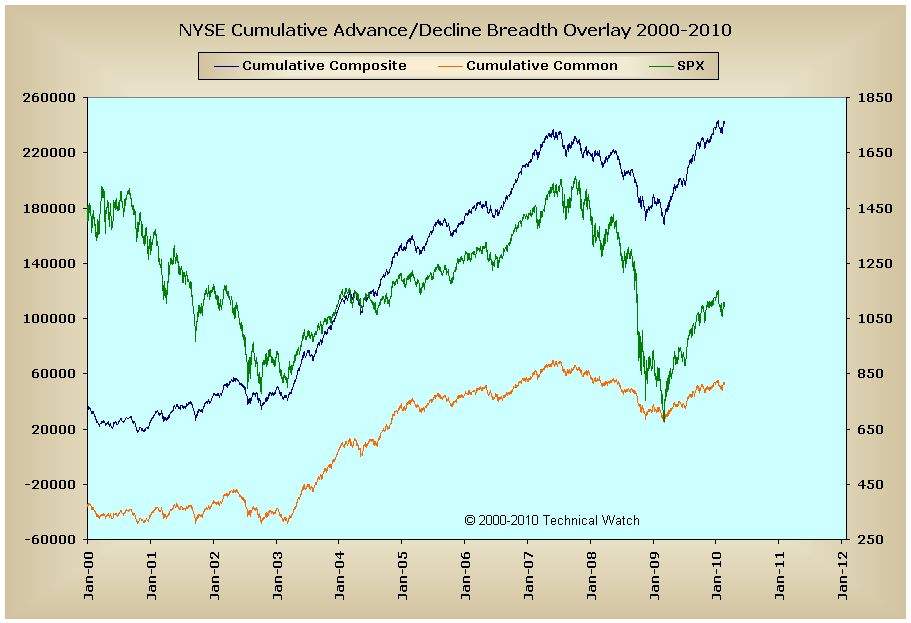
Atlas, here is the DP (common stock only AD Line) chart you are asking about - last three years shown below

Included below is a 10 year view of the commons along with the raw data (through Friday) for further digestion.

Fib

Posted Image

Better to ignore me than abhor me.

“Wise men don't need advice. Fools won't take it” - Benjamin Franklin


"Beware of false knowledge; it is more dangerous than ignorance" - George Bernard Shaw


Demagogue: A leader who makes use of popular prejudices, false claims and promises in order to gain power.

Technical Watch Subscriptions


#23 IYB

IYB

    Member

  • TT Patron+
  • 7,145 posts

Posted 28 February 2010 - 02:00 AM

Successive new highs on the cumulative A-D line (preferably running ahead of price) is a necessary but not sufficient condition for a sustainable market advance.

Given your point, what would be needed for a sufficient condition?

>>>>From my standpoint, that answer is complex, so just to over-simplify....I would just say certain minimum levels of thrust. As you know I use my Seven Sentinels to measure that. I know that answer itself is not "sufficient", but a meaningful answer would take more time than I have at the moment.

we have hundreds of derivative indicators like McO

Would you consider a moving average on a price chart a derivative of price?

>>>>Yes- absolutely. It's an index derived from manipulating available price information....


And now for something totally different...
Yes, there are similarities with the June-July 2009 pause in this recovery, but are we past the lows?
On July 1st, the AD line zoomed back up to its previous recovery high with the indexes stalling at about the .618 recovery eyeballing it. That did not prevent it from falling back down into the early July lower lows before taking off. Interesting fractal both for the NYAD and SPX.


Doc- that very point is the single heaviest weighing point on me currently. But I conclude (though I still allow 25% chance of the the retest) that because the McO's have achieved substantially higher levels this last week that in July 1 week, that we've (to borrow a term from an earlier post from Fib :) ) now achieved "escape velocity". Look, for example at the SP400 McO's from my earlier post. Have hit about +110 this last week compared to about +35 at peak in early July before retest. But it's a great point, and I watch carefully. I know you have Hurst lows ahead, so that, too, gives me pause. Best regards, D
“Men, it has been well said, think in herds; it will be seen that they go mad in herds, while they only recover their senses slowly, one by one.” Charles Mackay, Extraordinary Popular Delusions and the Madness of Crowds

#24 IndexTrader

IndexTrader

    Member

  • TT Patron+
  • 7,694 posts

Posted 28 February 2010 - 02:12 AM

We've had this debate many times over the years, long before your arrival. So I'm with Fib, I'm going to pass. Perhaps you could search the archives. Or alternatively, if you've convinced yourself that the A/D is meaningless, then simply don't use it.

Meanwhile, perhaps you could explain to me how the many closed-end bond funds and preferred stocks that are interest-rate sensitive and are included in the NYSE A/D line would have no forecasting ability for the indexes. Call me crazy, but I would think interest rates might have something to do with the direction of stock prices...but hey, what do I know?

IT


O.K. INDEXTRADER, you took a shot at me and ran off, but I'd still be happy to provide you with a brief explanatioin. It's actually an important question, notwithstanding your terrirotial attitude. One reason you can not include the bond funds, i.e. the well known TLT, is that it has the propensity to trend inversely to the stock market. Therefore, it skews the indicator.

No, you're not crazy; you just don't have the knowledge.


Ran off? :lol: I'll let my wife know that her social requirements now fall under YOUR category of "running off". Some of us occasionally have something else to do besides monitor this message board. Meanwhile, I've reviewed my post above to see exactly where I "took a shot at you". Help me out, I'm not seeing it. I do see a few "shots" on your part....which I'm going to let pass.

Your comments here, and on other threads, all indicate that you find the NYSE cumulative A/D line useless. So be it. I use the A/D every day in my trading. I have for years. I first started using it over 40 years ago. It provides an input that I find valuable, like other measures that I also look at. I have no problem at all with the idea that what I find valuable, you find useless. When I say valuable, what I mean is that I believe it gives helpful clues at times (not all the time) as to the short term direction of stock prices, which is mostly what I'm concerned with. That said, the A/D is not "perfect", and therefore it is only one of a number of tools that I look at.

I don't have a problem with the inclusion of interest rate related securities, despite your contention that it "skews" the index. You point out that TLT has a tendency to move against the trend of the stock market. IF that were true, then this would in fact mean that some securities in the NYSE A/D line were moving down, and perhaps moving down ahead of the peak of the general market. That the whole point isn't it? However, I've been around long enough to have seen interest rates move both with and against stock trends, so that TLT may not always be "skewing" the A/D line. The point is that there will always be securities moving up or down. Taken in their entirety they may well have something to say about the course of stock prices. I definitely want those interest rate related securities in there. Just chalk it up to my lack of knowledge Techman.

IT

#25 TechMan

TechMan

    Member

  • Traders-Talk User
  • 7,663 posts

Posted 28 February 2010 - 04:47 AM

Now I'm confused...why would you use something that has little or no analytical merit based on decimalization?

Even better...why would you use a portion of an A/D line of secondary (operating) issues that has been declining ever since its inception?


It's simple. As a trader, you'd want to look at everything as much as possible. It's like your criticism of me looking at the "past" fundamental econ data before. Remembered you’d questioned the relevance of me submitting the fundamentals to support my bearish argument back in December? Yet, you came back just to tell me that you’re also paying attention to the fundamentals. It may not have much to do with the VST trading as the technical data reflect whatever’s going on in the economy and beyond, but you’d still would look at them.

#26 TechMan

TechMan

    Member

  • Traders-Talk User
  • 7,663 posts

Posted 28 February 2010 - 05:07 AM

INDEXTRADER - I'm fine with the way you put it all in perspective in your last comment. Civility and mutual respect fascilitate flow of ideas and information. However, in the past month or two, you had taken 3 swipes at me, and I had let the first 2 times go. I don't know for sure if you meant it, but you had come across as quite territorial. If my comment hit a nerve that made you uncomfortable, no one's forcing you to read them. You can just skip all my postings. However, if you're in the true spirit of exchanging information, then I'd welcome more input from you.

#27 TechMan

TechMan

    Member

  • Traders-Talk User
  • 7,663 posts

Posted 28 February 2010 - 06:01 AM

I don't have a problem with the inclusion of interest rate related securities, despite your contention that it "skews" the index. You point out that TLT has a tendency to move against the trend of the stock market. IF that were true, then this would in fact mean that some securities in the NYSE A/D line were moving down, and perhaps moving down ahead of the peak of the general market. That the whole point isn't it?


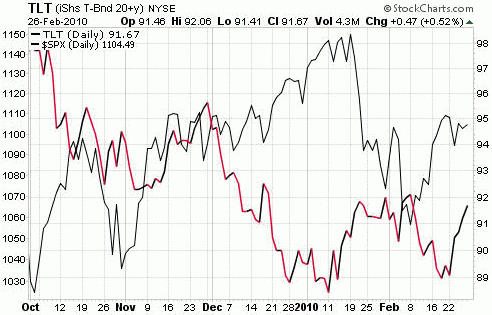
Being caught up in personal fued with you, I forgot to address your big IF. Chart below shows the inverse correlation between the TLT and the SPX. Of course, no correlation's perfect, and it also depends on the structure of the economy. For an instance, the Dollar's more relevant in recent years than pre 2004. In any case, this is one of Lowry's President Paul Desmond's issues with the AD Line.

tlt001.gif

#28 thespookyone

thespookyone

    Member

  • Traders-Talk User
  • 6,043 posts

Posted 28 February 2010 - 10:09 AM

Techman-thanks for the thread, everything here is worth discussion-and I have found your work a nice addition to the board. I'm glad no one seems to be holding back here, if there is emotion in the back and forth-so what?-the market is a cauldron of emotion anyway. Don-Your take was quite well put, nothing is a panacea, the A/D line included-but for myself, I consider the internals a major part of my outlook on the market going forward. That said, I know you feel escape velocity has been achieved-while I would favor a test of the zero line at a minimum here before I'm ready to commit large. I'd love to hear Fibs view on just that. Do we have escape velocity currently Fib-or do we dip first? Your and my viewpoints differ only in time Don-in a little big picture sense, I believe we are on the same page. Doc-Love that take, and always value your work highly. Thanks so much for your thoughtfull contributions here!

#29 spielchekr

spielchekr

    Member

  • Traders-Talk User
  • 3,104 posts

Posted 28 February 2010 - 10:19 AM

Its flaw is its inclusion of so much CDO, CMO, ABS, CLO, MBS, CDS, CBO, CPDO, LBO, MBO, CP, ABCP, etc. Many folks just refer to these as "bonds", but they are in fact the distinct forms of the structured finance instruments that caused the meltdown. They have yet to be honestly marked to market, and so the A/D line is a government subsidized indicator nowadays. It's a mere magic trick with the mechanics hidden from the audience's view. I mean c'mon, the A/D cumulative line sagged WAY WAY more before the 2000 meltdown than the 2008 meltdown. Does that make sense with any other explanation?

Holding the whole world on his shoulders, what if Atlas shrugs now?


Posted Image

Edited by spielchekr, 28 February 2010 - 10:27 AM.


#30 jjc

jjc

    Member

  • Traders-Talk User
  • 2,886 posts

Posted 28 February 2010 - 11:03 AM

As it would probably bore the reader to again rehash this debate, if you wish to see a breakdown of the components outlined by Paul you can see review them each and every week over at Technical Watch.

Here's a link to this weeks charts which have proved that Paul's earlier comments were...um..."misguided".

Fib


Many thanks fib!