For better archiving purpose, I post the swing type outlooks in this thread. The scope aims on trend speculation longer than a week, some ambiguity is unavoidable. To delve intraday speculation, I also post intraday outlook (in indexcalls.com) to synchronize the market movements. Since I am not a day trader, posting intraday outlook is on a irregular basis.
-----------------------------------------------------------------------------------------------
Posted on: Jul 5 2010, 08:35 PM
Intraday speculation:
http://indexcalls.co...o...st&p=585691
Resistance zone 1039-1048, 1071. supports 1008-998, 976.
Posted on: Jul 6 2010, 08:49 AM
http://indexcalls.co...o...st&p=585763
intraday high 1042.50 [projected zone 1039-1048]
drop to 1017-1019 & bounce off 1017-1019 to see 1068-1071.
[07/06 intraday low 1,018.35 high 1,042.50]
Posted on: Jul 7 2010, 11:10 AM
http://indexcalls.co...o...st&p=586011
Day's Range: 1,028.54 - 1,050.48 @this writing
The "congested nut" (1039-1048) has been "digested". By holding 1039, next target is 1068-1071 (gap)
[07/07 open 1,028.54 closing 1,060.27]
Posted on: Jul 8 2010, 11:45 AM
http://indexcalls.co...o...st&p=586218
Crafting the rhythms series 07/08/10
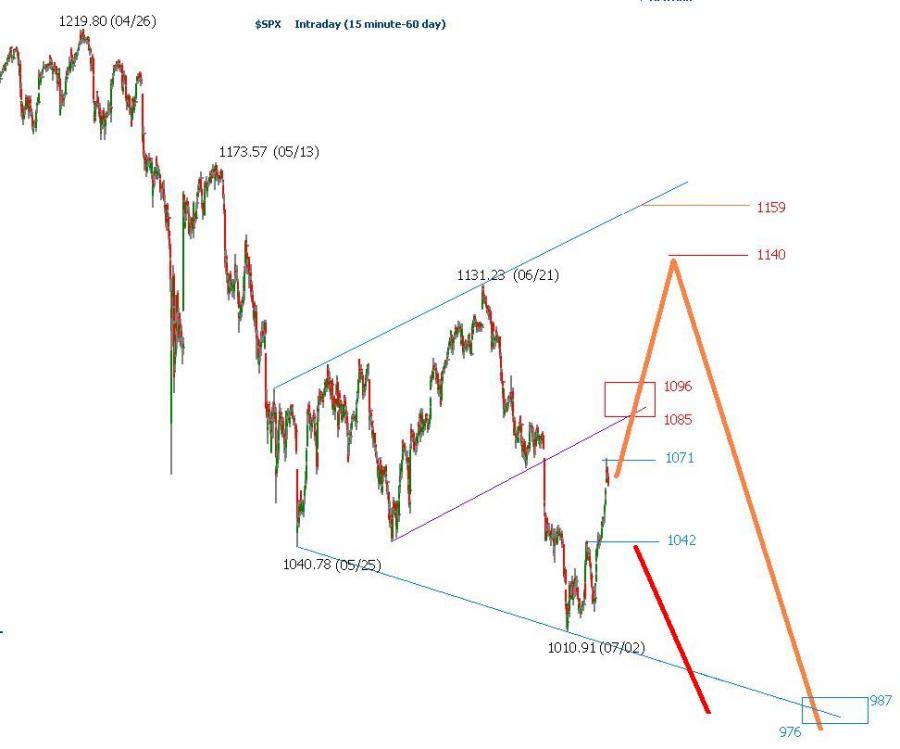
On 07/08, session high is 1071.25 @ this writing. A 0.5 retracement is neutral, 1071.07 = [0.5|1010.91:1131.23]), gap 1071.10-1071.45. The critical pivots to gauge the direction is 1096 [up] and 1042 [down].
[07/08 intraday high 1,071.25 low 1,058.24]
Posted on: Jul 9 2010, 11:47 AM
http://indexcalls.co...o...st&p=586411
1078 is the mean between 1071 & 1085
chart: http://indexcalls.co...01250_thumb.jpg
[07/09 intraday high 1,078.16]
Posted on: Jul 9 2010, 02:11 PM
http://indexcalls.co...o...st&p=586458
closing remark: Earnings & outlooks sets the tone
0.382 1090.70 [1219.80:1010.91] frame 04/26-07/01
0.500 1071.07 [1131.23:1010.91] frame 06/21-07/01
0.618 1085.27
0.707 1095.98 > 1090.70
-----------------------------------------------------------------------------------------------
comments:
The critical pivots to gauge the direction is 1096 [up] and 1042 [down].
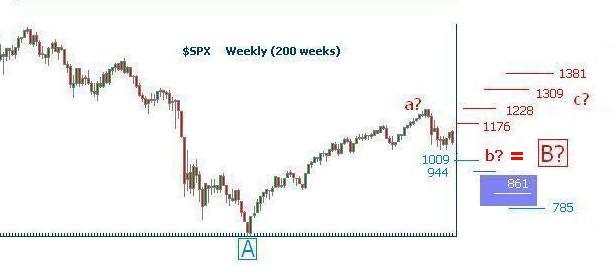
The half power point 0.707 for short term frame 06/21-07/01 is 1095.98, about 6 points higher than 0.382 retracement for intermediate frame 06/21-07/01 @ 1090.70. So, I pick 1096 as a gauge for bullish scenario. The middle term wave structure remains unclear. So far the pullback from 1219 (04/26) is considered a correction of a longer term bullish wave structure, with an unrealized middle term second target 944-948. The first target (around 1008) had been met on 07/01 (1010.91)

Crafting the rhythms
Started by
stanley
, Apr 13 2010 12:58 PM
140 replies to this topic
#22

stanley
-
- Traders-Talk User
- 167 posts
Member
Posted 13 July 2010 - 02:28 PM
Crafting the rhythms series 07/13/10
On 07/13 indraday, Index takes out 1096.
[1] status in quo, locus in quo
Index takes out 1096 marginally.
Big IF Intel deliver positive earning & positive outlook, The next obvious zone is 1107-1123.
------------------------------------------------------------------------
Jul 9 2010, 02:11 PM
closing remark: Earnings & outlooks sets the tone
The critical pivots to gauge the direction is 1096 [up] and 1042 [down].
Jul 8 2010, 11:44 AM
------------------------------------------------------------------------
[2] near term
Index is approaching to a (secondary?) rolling point, 07/26 - 08/10 [07/30?]
------------------------------------------------------------------------
Jul 8 2010, 11:44 AM
the index status on 07/26 is becoming exciting.
High
03/06/09 BASE
06/11/09 67TD 0939.04
10/21/09 91TD 1101.36
01/19/10 59TD 1150.45
04/26/10 66TD 1219.80
07/26/10 63TD ????
Low
03/06/09 BASE
07/08/09 85TD 0869.32
11/02/09 82TD 1019.95
02/05/10 64TD 1044.50
07/01/10 101D 1010.91
07/27/10 117?
Fibonacci Time Zone (ratio 1.00) due 07/30/10[-08/10/10].
------------------------------------------------------------------------
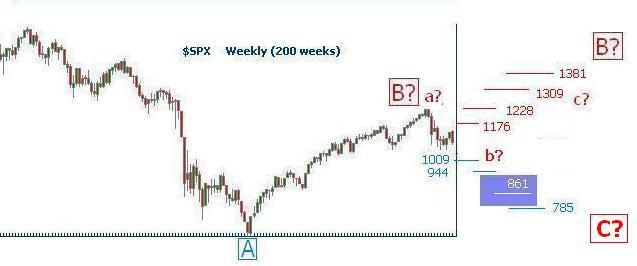
[3] quo vadis?
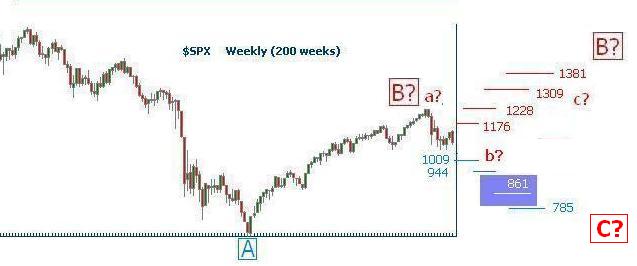
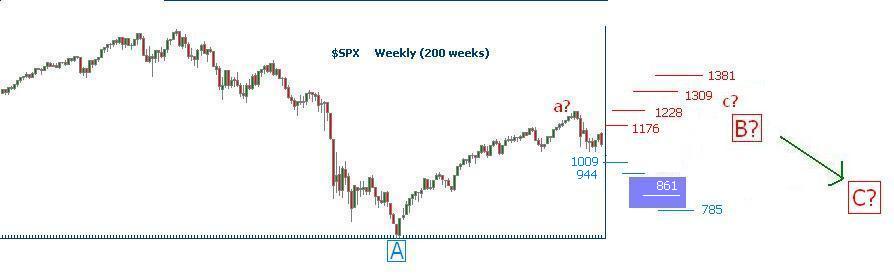
check point 1176 & 785.
------------------------------------------------------------------------
Jun 5 2010, 06:22 PM
At this moment, the wave structure in the large scale time frame remains bullish. the intermediate frame wave structure does not manifest itself
Jun 27 2010, 06:27 PM
chart: http://traders-talk....-1277686575.jpg
Jun 30 2010, 08:42 PM
785 is a pretty tough gauge. to be elaborated
Jul 5 2010, 06:36 PM
Large frame
1220-0667 0.382 1008
1220-0667 0.500 0944
1220-0667 0.786 0785 travels down to this level marks the end of the rally since March 09.
0667-1576 0.786 0861
------------------------------------------------------------------------
On 07/13 indraday, Index takes out 1096.
[1] status in quo, locus in quo
Index takes out 1096 marginally.
Big IF Intel deliver positive earning & positive outlook, The next obvious zone is 1107-1123.
------------------------------------------------------------------------
Jul 9 2010, 02:11 PM
closing remark: Earnings & outlooks sets the tone
The critical pivots to gauge the direction is 1096 [up] and 1042 [down].
Jul 8 2010, 11:44 AM
------------------------------------------------------------------------
[2] near term
Index is approaching to a (secondary?) rolling point, 07/26 - 08/10 [07/30?]
------------------------------------------------------------------------
Jul 8 2010, 11:44 AM
the index status on 07/26 is becoming exciting.
High
03/06/09 BASE
06/11/09 67TD 0939.04
10/21/09 91TD 1101.36
01/19/10 59TD 1150.45
04/26/10 66TD 1219.80
07/26/10 63TD ????
Low
03/06/09 BASE
07/08/09 85TD 0869.32
11/02/09 82TD 1019.95
02/05/10 64TD 1044.50
07/01/10 101D 1010.91
07/27/10 117?
Fibonacci Time Zone (ratio 1.00) due 07/30/10[-08/10/10].
------------------------------------------------------------------------
[3] quo vadis?
check point 1176 & 785.

------------------------------------------------------------------------
Jun 5 2010, 06:22 PM
At this moment, the wave structure in the large scale time frame remains bullish. the intermediate frame wave structure does not manifest itself
Jun 27 2010, 06:27 PM
chart: http://traders-talk....-1277686575.jpg
Jun 30 2010, 08:42 PM
785 is a pretty tough gauge. to be elaborated
Jul 5 2010, 06:36 PM
Large frame
1220-0667 0.382 1008
1220-0667 0.500 0944
1220-0667 0.786 0785 travels down to this level marks the end of the rally since March 09.
0667-1576 0.786 0861
------------------------------------------------------------------------
#23
stanley
-
- Traders-Talk User
- 167 posts
Member
Posted 13 July 2010 - 11:17 PM
chart in prior post is ambiguous. here is the "correct" one
archive
-------------------------------------------------
Apr 13 2010, 10:58 AM Post #1 in this thread
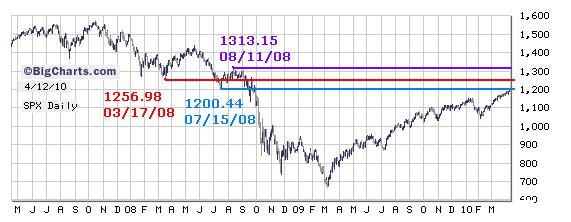
When index exceeds 1256.98 (refer to the chart shown below) the wave status since March 09 may separate from the prior one (1576-->667) and become an individual segment. When the wave is becoming a separate segment, it is capable of reaching 1300 level. The half power point 0.707 from 667 to 1576 is 1310, very close to the High 1313.15 marked on 08/11/08.
-------------------------------------------------
archive
-------------------------------------------------
Apr 13 2010, 10:58 AM Post #1 in this thread
When index exceeds 1256.98 (refer to the chart shown below) the wave status since March 09 may separate from the prior one (1576-->667) and become an individual segment. When the wave is becoming a separate segment, it is capable of reaching 1300 level. The half power point 0.707 from 667 to 1576 is 1310, very close to the High 1313.15 marked on 08/11/08.
-------------------------------------------------
#24
stanley
-
- Traders-Talk User
- 167 posts
Member
Posted 14 July 2010 - 09:50 AM
AP Business Writer, On Wednesday July 14, 2010, 9:59 am
"Stocks mostly fell Wednesday after a disappointing retail sales report chilled optimism from Intel's strong earnings and outlook."
archive
----------------------------
Jun 5 2010, 06:22 PM
This poster believes it is the market underlying intrinsic value determines the wave structure.
Jul 5 2010, 06:36 PM
wave theory only provides a thought process, Market index obeys its own law; Time is a magnificent machine working out these overhang saga; Whether an event will transpire can be perceived by a gauge or pivot. The usage is not only works in the movement polarity but also for the displacement.
Jul 9 2010, 02:11 PM
The critical pivots to gauge the direction is 1096 [up] and 1042 [down].
Time gauge given in post #20
#25
stanley
-
- Traders-Talk User
- 167 posts
Member
Posted 15 July 2010 - 01:15 PM
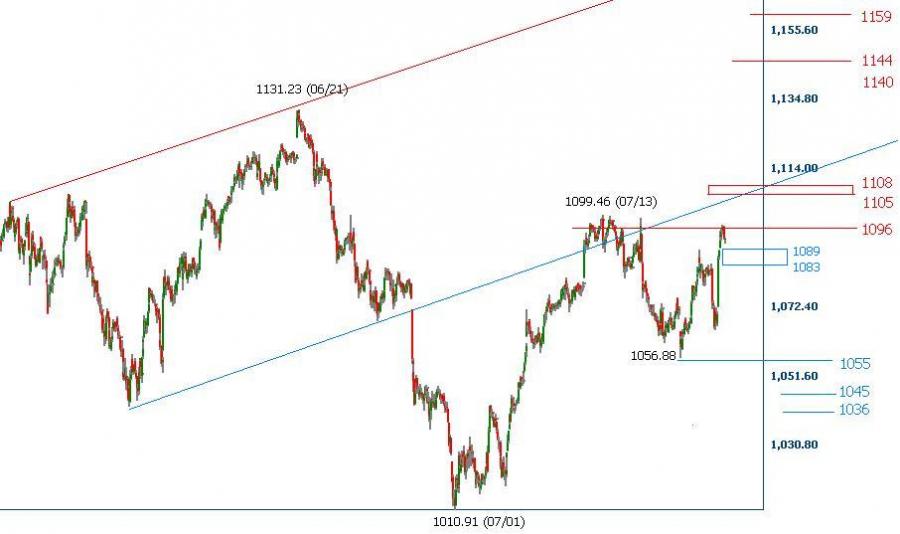
Crafting the rhythms series 07/15
refer to chart Jul 8 2010, 11:44 AM. I put new traces into the old chart, shown below.
the resistance zone 1085-1096 served as a damper, index pricked 1099.46 on 07/13 then reversed. It is a rough 0.707 [actual 0.735] retracement of the segment from 1131.23 (06/21) to 1010.91 (07/01) . Count from 1099.46, an equal movement to the down side will put index at 979.14. If you think it is not lower enough, just use wave extensions to get your "preferred" number. However, index need to crack 1042-1044 for better confirmation.
Wave 3 of 4 of 7 ??? ....
wave theory only provides a thought process, Market index obeys its own law.
Jul 9 2010, 02:11 PM
The critical pivots to gauge the direction is 1096 [up] and 1042 [down].

#26
stanley
-
- Traders-Talk User
- 167 posts
Member
Posted 22 July 2010 - 11:53 AM
SPX 07/22/10
intraday high 1096.55 @ this writing.
I did minor adjustments on support & resistance, refer to the chart shown below.
archives
-----------------------------------------------
Posted on: Jul 20 2010, 01:08 PM
link
Index bounced off the FIB ratio 0.5 1055 [actual 1056.88] but enounters the resistance 1085 [actual 1083.94].
The sentiment to have the second attempt on 1096 (a pivot to the upper side) is obvious.
Posted on: Jul 8 2010, 11:44 AM
link
The critical pivots to gauge the direction is 1096 [up] and 1042 [down].
-----------------------------------------------
chart 07/15

#27
stanley
-
- Traders-Talk User
- 167 posts
Member
Posted 23 July 2010 - 05:26 PM
Crafting the rhythms series 07/23/10
In session 07/23, intraday low 1087.88, high 1103.73.
For bullish scenario: To see 1140-1144, the resistance zone 1105.48 -1108.24 in this chart is the first hurdle needs to be removed. The target projection encounters some uncertainty because the waves with different time frame overlaps in the zone 1137-1159.
By surmounting (closing above) the gauge 1096 (d), this action is a caveat for
Here is the Thought process: Even If Index reverses down before hitting the aforementioned resistance zone, the Fibonacci time zone ratio 1.0 suggests the actions in the time window 07/26-08/10, ( b ), could be a secondary event. This secondary event will be a good guide to perceive the wave structure in October, ( a ).
For longer term speculation, the index trajectory gives faint hint. refer to the chart in ( c )[3], So far, the first middle term target (1014-1001, speculated on 12/31/09) has been met on 07/01, 948-962 ( revised as 944-948) is an unrealized middle term target.
( a ) Jul 5 2010, 08:35 PM Post #19
Crafting the rhythms series 07/05/10
The second target is around 944-948.
Long PI
04/15/10 actual 04/26, error 2.2PI. index deployed a middle term High
09/17/10 realigned to 10/19 [+/- 4PI]
( b ) Jul 8 2010, 11:44 AM
the index status on 07/26 is becoming exciting
Fibonacci Time Zone (ratio 1.00) due 07/30/10[-08/10/10].
( c ) Jul 13 2010, 11:54 AM, post #22
link
[2] near term
Index is approaching to a (secondary?) rolling point, 07/26 - 08/10 [07/30?]
[3] quo vadis?
chart: http://traders-talk....-1279080617.jpg
( d ) Jul 8 2010, 11:44 AM
The critical pivots to gauge the direction is 1096 [up] and 1042 [down].
Jun 27 2010, 06:27 PM
Second half may be full of surprises & volatilities, .... let me reiterate one more time that we need some entertainments in this fascinating market. Technical analysis is a windsock, not a crystal ball [Carl Swenlin]
Year of the Tiger

But, ... "Tail" Down or Up? which one?

#28
stanley
-
- Traders-Talk User
- 167 posts
Member
Posted 28 July 2010 - 10:57 AM
Crafting the rhythms series 07/28/10
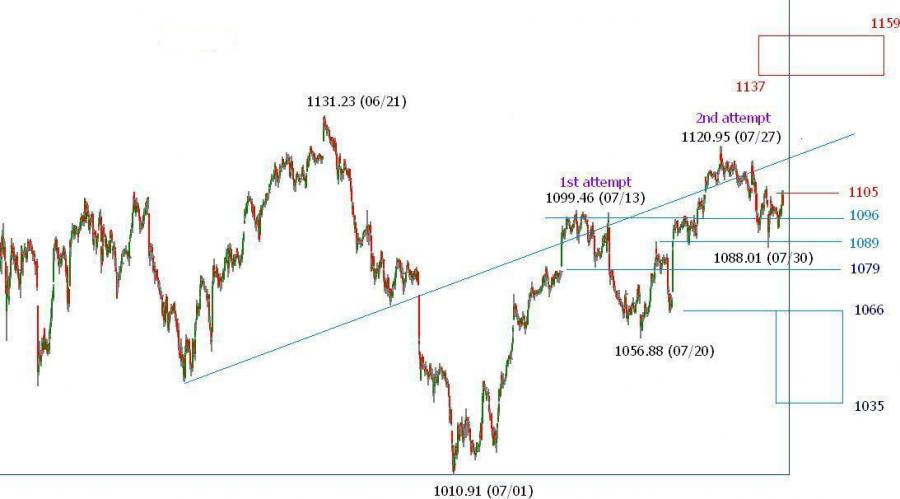
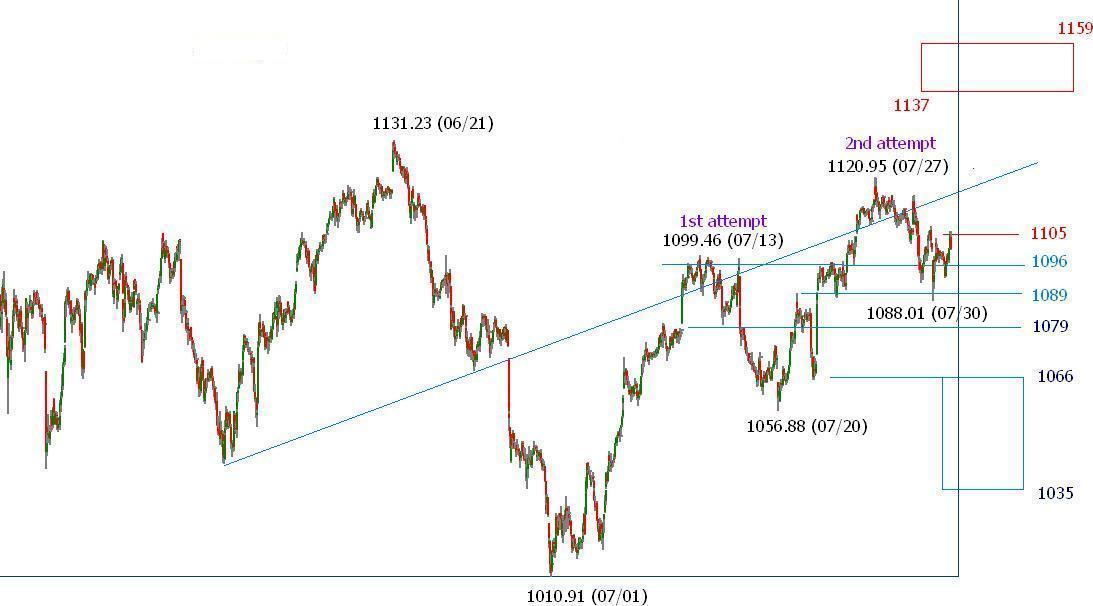
It is the market underlying intrinsic value determines the wave structure, After another disappointing economic report, the June Durable Goods [0], the index has likely topped on 07/27. The (seconday top) time window is up to 08/10, [1][2][3]. The follow-through actions could be consolidations with resistance zone 1137-1159, initial trend reversal gauge 1079, and lower consolidation zone 1066 1035. This secondary event will be a good guide to perceive the wave structure in October, [4].
[0]
US Department of Commerce - WEDNESDAY, JULY 28, 2010, AT 8:30 A.M. EDT
Advance Report on Durable Goods Manufacturers Shipments, Inventories and Orders
June 2010
http://www.census.go...v/pdf/durgd.pdf
New Orders
New orders for manufactured durable goods in June decreased $2.0 billion or 1.0 percent to $190.5 billion, ... This was the second consecutive monthly decrease and followed a 0.8 percent May decrease. Excluding transportation, new orders decreased 0.6 percent. Excluding defense, new orders decreased 0.7 percent.
Inventories
Inventories of manufactured durable goods in June, up six consecutive months, increased $2.8 billion or 0.9 percent to $308.2 billion. This followed a 1.1 percent May increase.
Transportation equipment, up six consecutive months, had the largest increase, $0.8 billion or 1.1 percent to $80.0 billion.
[1]
King Wens Sequence
Jul 8 2010, 11:44 AM
High
03/06/09 BASE
06/11/09 67TD 0939.04
10/21/09 91TD 1101.36
01/19/10 59TD 1150.45
04/26/10 66TD 1219.80
07/26/10 63TD ???? [to be confirmed]
Low
03/06/09 BASE
07/08/09 85TD 0869.32
11/02/09 82TD 1019.95
02/05/10 64TD 1044.50
07/01/10 101D 1010.91 This low is confirmed as of 07/27
07/27/10 117? this case is Out,
[2]
Fibonacci Time Zone (ratio 1.00) due 07/30/10 [07/21 - 08/10].
[3]
Fibonacci retracements & waves
Jul 8
http://traders-talk....14590_thumb.jpg
Jul 22
http://indexcalls.co...17951_thumb.jpg
1099.46 1010.91 + 1056.88 = 1145.43
(1219.80 1040.78) * 0.707 + 1010.91 = 1137.48
(1219.80 1040.78) * 0.618 + 1010.91 = 1121.54 [07/27 intraday high 1120.95]
1173.57 1040.78 + 1010.91 = 1143.7
(1219.9 1010.91) * 0.707 + 1010.91 = 1158.67
(1219.9 1010.91) * 0.618 + 1010.91 = 1140.06
[4]
Long PI
04/15/10 actual 04/26, error 2.2PI. index deployed a middle term High
09/17/10 realigned to 10/19 [+/- 4PI]
Archives
Jul 23 2010, 03:26 PM
For bullish scenario: To see 1140-1144, the resistance zone 1105.48 -1108.24 in this chart is the first hurdle needs to be removed. The target projection encounters some uncertainty because the waves with different time frame overlaps in the zone 1137-1159.
Here is the Thought process: Even If Index reverses down before hitting the aforementioned resistance zone, the Fibonacci time zone ratio 1.0 suggests the actions in the time window 07/26-08/10, could be a secondary event.
Jul 11 2010, 05:38 PM
So far the pullback from 1219 (04/26) is considered a correction of a longer term bullish wave structure, with an unrealized middle term second target 944-948. The first target (around 1008) had been met on 07/01 (1010.91)
#29
stanley
-
- Traders-Talk User
- 167 posts
Member
Posted 02 August 2010 - 12:01 AM
Crafting the rhythms series 08/01/10
On 07/30, index marked an intraday low 1,088.01, it is about 9 points higher than the reversal gauge 1079.
Since the time window to expect a secondary high is up to 08/10, (2.2PI, 7 trading days from 07/30), the actions in the next few sessions becomes critical, IF index cannot dive below 1079, there is a good chance index may spring up to 1137 due to the following two technical reasons:
(1) 1219.80 1040.78) * 0.707 + 1010.91 = 1137.48 [refer to archive Jul 28]
(2) Sometimes the time movement let each segments vertical length deploy a simple magic ratios
The following chart depicts a nearly perfect wave ratios (1.5 & 2.0). if ratio 1.5 repeats one more time it will put index at 1137.42.
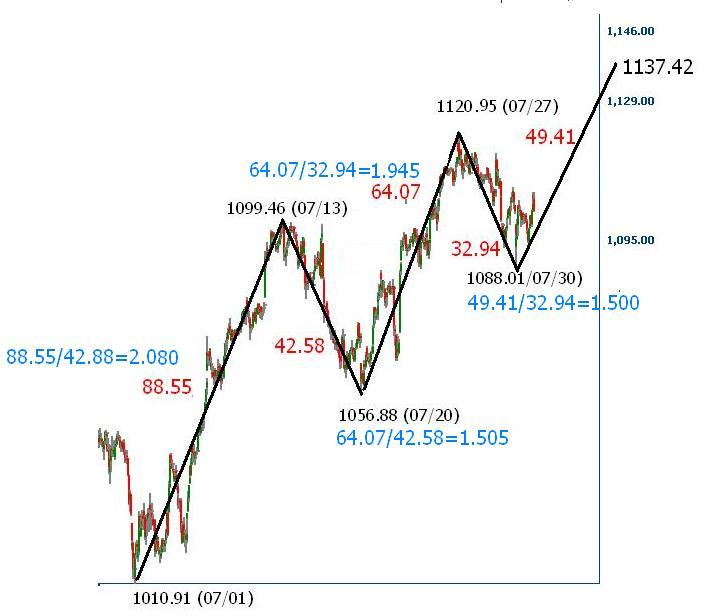

chart courtesy of www.elliottwavesignals.com
Archives:
Posted on: Jul 31, 10:57 PM
http://indexcalls.co...o...st&p=590394
Races with the Ascending Trend Line.
The (seconday top) time window is up to 08/10, initial trend reversal gauge 1079.
Jul 30, 2010 intraday High 1,106.44 low 1,088.01
Posted on: Jul 29 2010, 09:49 AM
http://indexcalls.co...o...st&p=590043
One important hint is the wave bounced off 1010.91 on 07/01 is still part of the down wave since 04/26. The rally off the 07/01's low travled 0.618 out of [1219.80 1040.78] is the evidence that there is no separation yet. However, there is no confirmation the rally since 07/01 is complete.
short term/Intraday support given in the following chart:
chart: http://indexcalls.co...22553_thumb.jpg
Jul 28 2010, 08:57 AM
http://www.traders-t...?...st&p=536701
the index has likely topped on 07/27. The (seconday top) time window is up to 08/10, [1][2][3]. The follow-through actions could be consolidations with resistance zone 1137-1159, initial trend reversal gauge 1079,
chart Jul 8
Fibonacci retracements & waves
1219.80 1040.78) * 0.707 + 1010.91 = 1137.48
(1219.80 1040.78) * 0.618 + 1010.91 = 1121.54 [07/27 intraday high 1120.95]
On 07/30, index marked an intraday low 1,088.01, it is about 9 points higher than the reversal gauge 1079.
Since the time window to expect a secondary high is up to 08/10, (2.2PI, 7 trading days from 07/30), the actions in the next few sessions becomes critical, IF index cannot dive below 1079, there is a good chance index may spring up to 1137 due to the following two technical reasons:
(1) 1219.80 1040.78) * 0.707 + 1010.91 = 1137.48 [refer to archive Jul 28]
(2) Sometimes the time movement let each segments vertical length deploy a simple magic ratios
The following chart depicts a nearly perfect wave ratios (1.5 & 2.0). if ratio 1.5 repeats one more time it will put index at 1137.42.
chart courtesy of www.elliottwavesignals.com
Archives:
Posted on: Jul 31, 10:57 PM
http://indexcalls.co...o...st&p=590394
Races with the Ascending Trend Line.
The (seconday top) time window is up to 08/10, initial trend reversal gauge 1079.
Jul 30, 2010 intraday High 1,106.44 low 1,088.01
Posted on: Jul 29 2010, 09:49 AM
http://indexcalls.co...o...st&p=590043
One important hint is the wave bounced off 1010.91 on 07/01 is still part of the down wave since 04/26. The rally off the 07/01's low travled 0.618 out of [1219.80 1040.78] is the evidence that there is no separation yet. However, there is no confirmation the rally since 07/01 is complete.
short term/Intraday support given in the following chart:
chart: http://indexcalls.co...22553_thumb.jpg
Jul 28 2010, 08:57 AM
http://www.traders-t...?...st&p=536701
the index has likely topped on 07/27. The (seconday top) time window is up to 08/10, [1][2][3]. The follow-through actions could be consolidations with resistance zone 1137-1159, initial trend reversal gauge 1079,
chart Jul 8
Fibonacci retracements & waves
1219.80 1040.78) * 0.707 + 1010.91 = 1137.48
(1219.80 1040.78) * 0.618 + 1010.91 = 1121.54 [07/27 intraday high 1120.95]
#30
stanley
-
- Traders-Talk User
- 167 posts
Member
Posted 02 August 2010 - 01:27 PM
As of 08/02, It is 68 TDs (trading days) from the 4/26 high @ 1219.80. The time window for this secondary high is up to 08/10.Wait just a few more sessions for confirmation. I guess something ties with - 135° August 7, start of autumn ( ZEN: the The Beginning of Autumn, http://indexcalls.co...o...st&p=590358 ).
If the rhythm repeats, the secondary low is at least 54 TDs from 07/01....
High
03/06/09 BASE 0666.79
06/11/09 67TD 0939.04
10/21/09 91TD 1101.36
01/19/10 59TD 1150.45
04/26/10 66TD 1219.80
08/02/10 68?? ???? [to be confirmed]
Low
03/06/09 BASE
07/08/09 85TD 0869.32
11/02/09 82TD 1019.95
02/05/10 64TD 1044.50
07/01/10 101D 1010.91 This low is confirmed as of 07/27
07/27/10 117? this case is Out,
King Wens Sequence link
archives:
Sep 7 2009, 01:46 PM
the wave structure since Marchs low (09) looks bullish
Jun 5 2010, 06:22 PM
the wave structure in the large scale time frame remains bullish.
the intermediate frame wave structure does not manifest itself


