Bear Market Roadmap Update
#1

Posted 05 March 2016 - 01:41 PM
People think the Holy Grail is something looked for but never found. In fact, it is something often found but rarely recognized.
#2

Posted 05 March 2016 - 01:55 PM
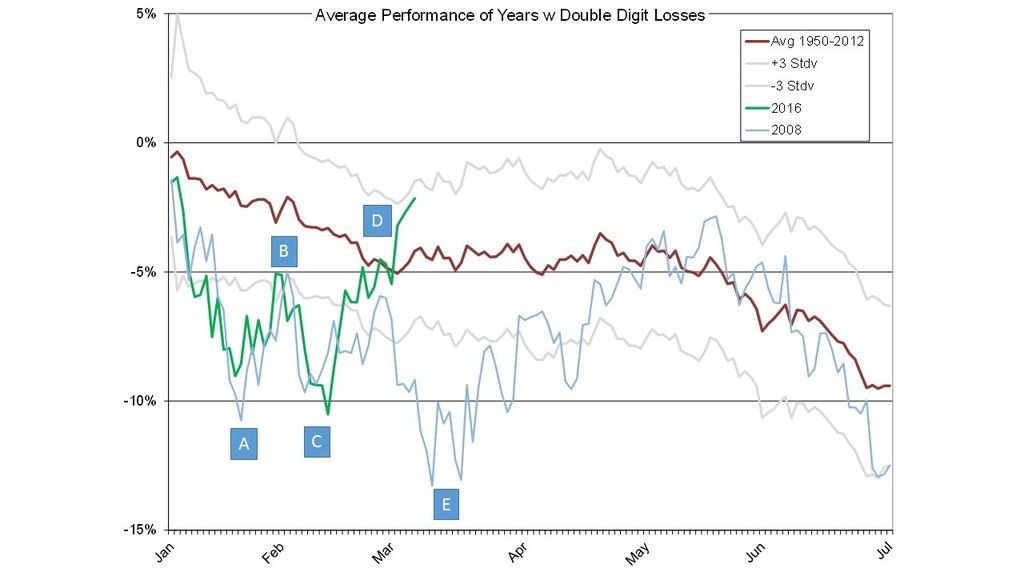
Thought this was an interesting chart. If history is a guide, the likelihood is that we will be higher over next 3 months or so. Just food for thought.

Edited by viccarter, 05 March 2016 - 01:56 PM.
#3

Posted 05 March 2016 - 04:21 PM
Vic - the strength of this "counter-trend" rally concerns me. I wonder if it is truly counter-trend?
I see that the 75-85 day holding period was profitable 93% of the time. Do you know the instances that holding period was unprofitable?
People think the Holy Grail is something looked for but never found. In fact, it is something often found but rarely recognized.
#4

Posted 05 March 2016 - 04:54 PM
i dont believe this is a counter trend rally fwiw. but i do believe after this rally ends we will see a true impulse wave to the down side and that the banks especilally will be devastated
watching the bkx at its 200 dma
#5

Posted 05 March 2016 - 05:31 PM
i dont believe this is a counter trend rally fwiw. but i do believe after this rally ends we will see a true impulse wave to the down side and that the banks especilally will be devastated
watching the bkx at its 200 dma
FWIW
DecisionPoint Market Scoreboard: http://stockcharts.c.../dpgallery.html
A summary of the DecisionPoint signals from the Market Trend charts below:
DecisionPoint
STOCKS: Looking Long-Term
Carl Swenlin | February 27, 2016 at 11:16 PM
http://stockcharts.c...-long-term.html
CONCLUSION: Today the monthly PMO confirms many other indications that a bear market is in progress. While it is possible for a reversal to take place, that is not typically what happens with a PMO configuration sporting a smooth PMO top, downside crossover, and extended drawdown, such as we currently have. I anticipate an outcome that resembles the declines from the 2000 and 2007 market tops. That is to say that the monthly PMO should continue downward and possibly cross down through the zero line before a long-term price bottom forms.
#6

Posted 05 March 2016 - 08:31 PM
Vic - the strength of this "counter-trend" rally concerns me. I wonder if it is truly counter-trend?
I see that the 75-85 day holding period was profitable 93% of the time. Do you know the instances that holding period was unprofitable?
No, unfortunately not my chart. Saw it posted by respected trader on Twitter.
#7

Posted 06 March 2016 - 09:44 AM
It's started to diverge from the 2001 and 2008 charts, and converge with the 2000 chart.
http://www.mrci.com/special/wspi00.php
If you like analogs, there's a possibility that it's tracing out a large triple top similar to the smaller triple tops in May-July 2015 and October-December 2015. In that case, the three tops would be formed from March through May before a large drop. The highs would be around 2100-2070.
Both McClellan and DeMark were looking for a peak last week, a new low in April, and a new all-time high after that.
Edited by Data, 06 March 2016 - 09:45 AM.


